

Clinical Disease Risk Assessment System Based on Multi-source Genetic Information
-
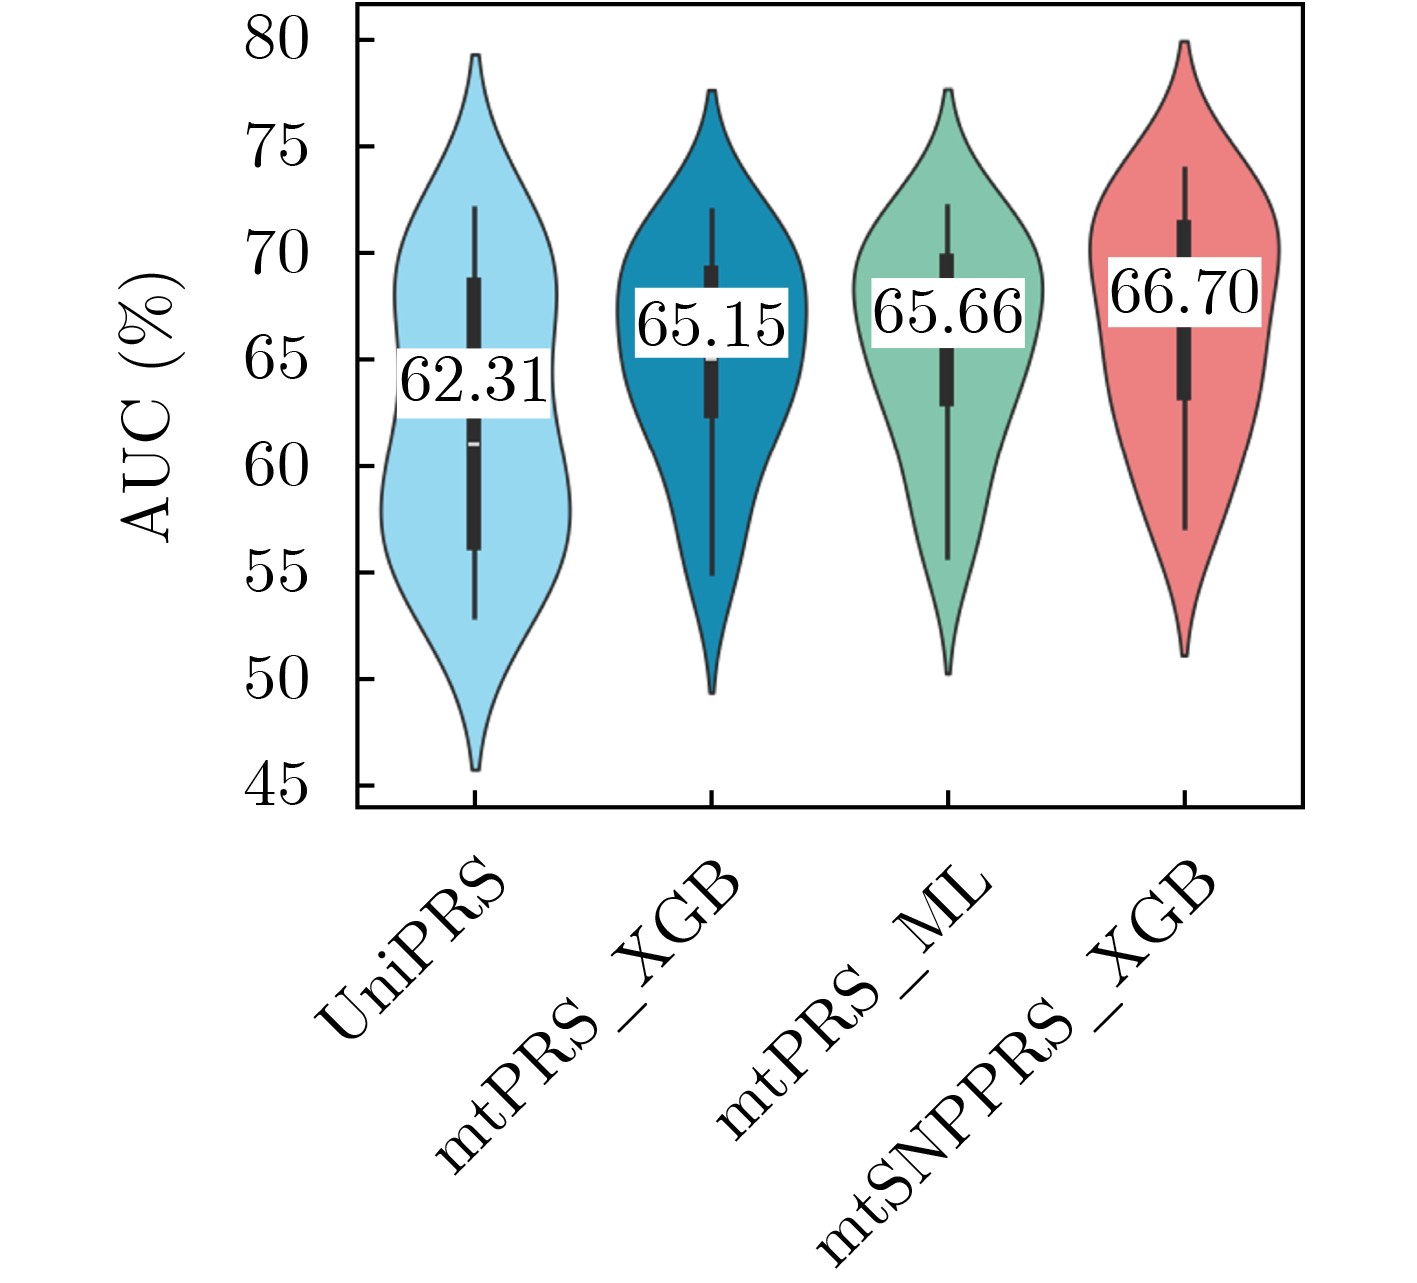
摘要: 复杂疾病由多基因遗传与环境因素共同作用,致病机制高度异质,且具有高流行率和高致死率,构成重大公共卫生挑战。传统单疾病多基因风险评分(PRS)仅整合单一性状的遗传变异,忽视跨性状遗传相关性,预测效能受限;同时,多数方法依赖线性建模,难以刻画单核苷酸多态性(SNP)间及SNP与PRS之间的非线性交互,也未充分挖掘多类疾病PRS所蕴含的共享遗传信息。针对上述不足,该文提出一种基于统计学习的多源PRS疾病预测模型mtSNPPRS_XGB,创新性地构建SNP-PRS融合架构,利用XGBoost捕捉多源遗传特征的非线性交互。该模型联合整合原始SNP数据与多源PRS信息,在UK Biobank的18种疾病中取得平均AUC 66.70%(95%置信区间:66.46%~66.95%),较传统UniPRS提升4.39%,较基于弹性网络的模型提升1.04%。研究为复杂疾病个体化遗传风险预测提供了新思路。Abstract:
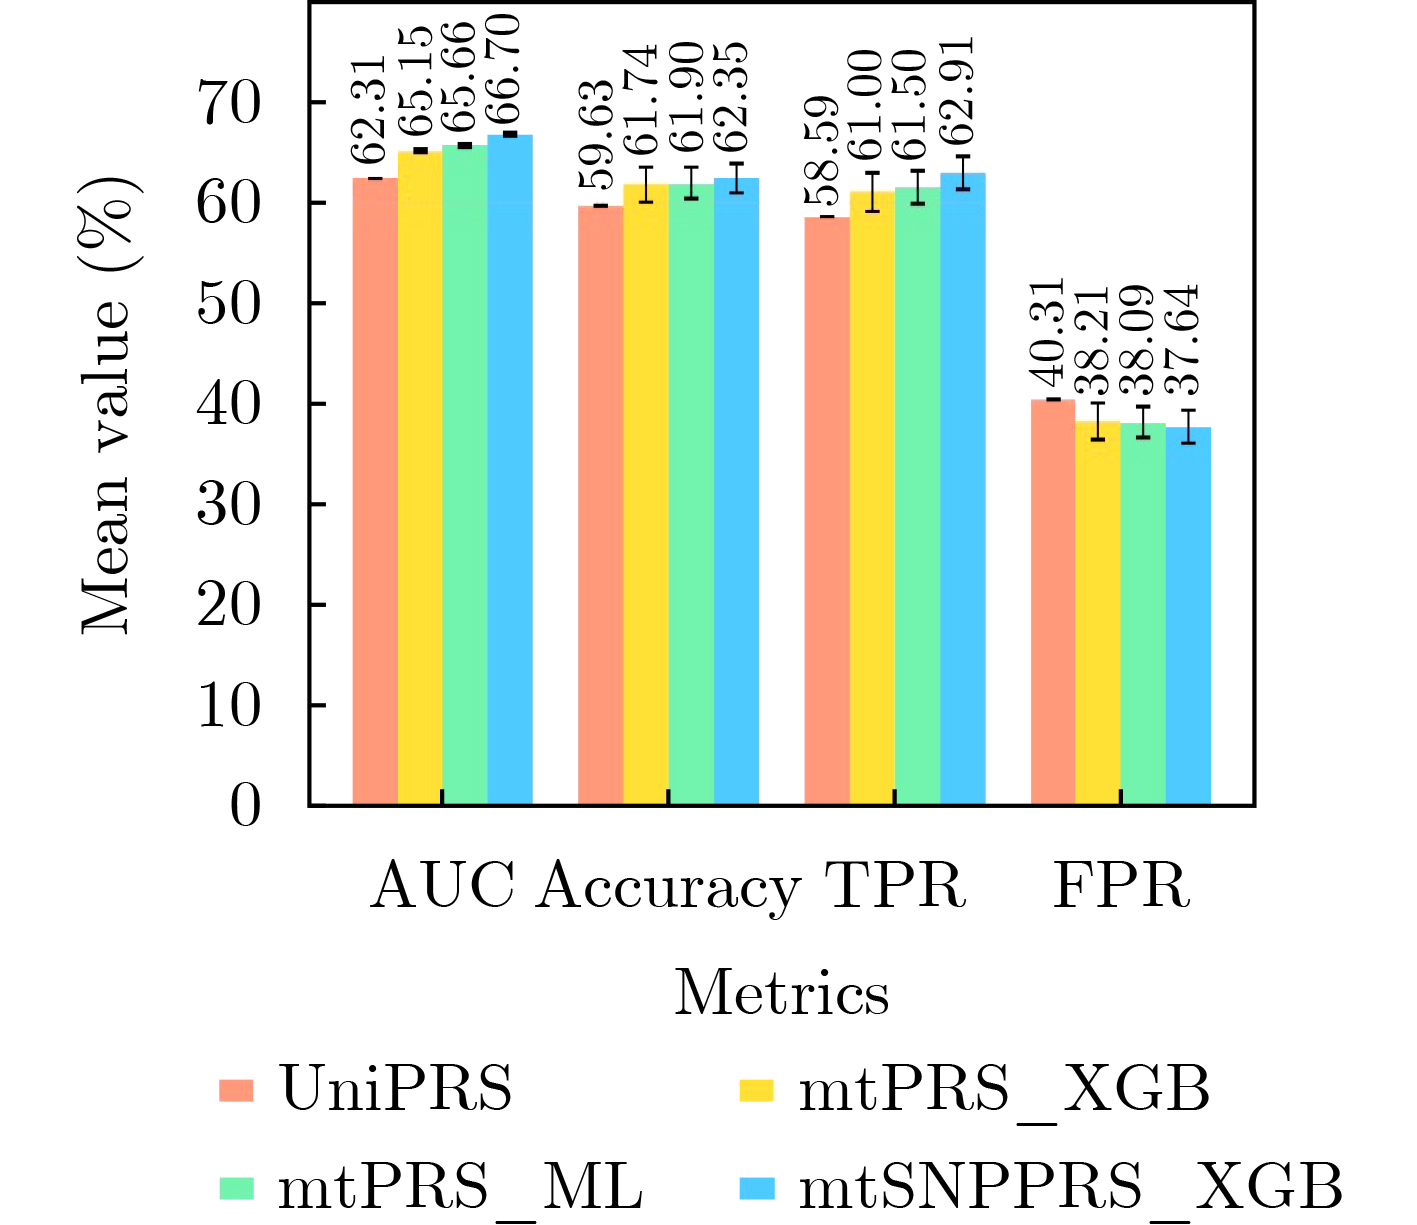
Objective Complex diseases are driven by polygenic inheritance and gene–environment interactions, resulting in highly heterogeneous pathogenic mechanisms and posing major challenges for both research and public health. Conventional single-trait polygenic risk scores (PRS) aggregate genetic variants associated with individual diseases but are limited by their neglect of cross-trait genetic correlations and nonlinear genetic interactions. Although multi-trait PRS approaches have been proposed to improve prediction accuracy, existing statistical-learning frameworks predominantly rely on linear integration of PRS features, failing to capture nonlinear interactions among single-nucleotide polymorphisms (SNPs) and to fully exploit shared genetic information across diseases. To address these limitations, we propose a nonlinear multi-source disease prediction framework, the SNP–PRS Fusion model, termed the mtSNPPRS_XGB (mtSNP-PRS XGBoost Integration Model). Methods The mtSNPPRS_XGB framework integrates raw SNP data of target traits with multi-trait PRS information to enhance genetic risk prediction for complex diseases through nonlinear modeling. SNPs significantly associated with target diseases were extracted from the GWAS Catalog (p < 5 × 10⁻⁸) and encoded as allele dosages (0/1/2), while PRS weights covering 80 traits were obtained from the PGS Catalog and used to compute individual PRS. After standardized preprocessing, SNP and PRS features were jointly fused and modeled using XGBoost to capture complex SNP-SNP and SNP-PRS interactions. This framework introduces two key innovations: (1) collaborative modeling of multi-trait genetic information by jointly leveraging disease-specific SNPs and cross-disease PRS, and (2) systematic learning of nonlinear genetic interactions to overcome the linear constraints of conventional PRS-based models. Results and Discussions The mtSNPPRS_XGB model was evaluated using UK Biobank data across 18 complex diseases. It achieved an average AUC of 66.70%, representing improvements of 1.04% over the elastic-net-based model and 4.39% over the conventional UniPRS model. The inclusion of SNP features substantially improved predictive performance in diseases such as coronary heart disease, psoriasis, and celiac disease, while the integration of multi-trait PRS further enhanced specificity, particularly in cardiovascular, autoimmune, and cancer-related conditions. SHAP-based interpretability analyses demonstrated that mtSNPPRS_XGB simultaneously captures global cross-disease genetic liability encoded by PRS and disease-specific localized SNP effects, as illustrated in Alzheimer’s disease, colorectal cancer, gout, and ischemic stroke. These findings support both the biological plausibility and interpretability of the proposed framework. Conclusions We present a novel statistical learning-based multi-trait genetic risk prediction model, mtSNPPRS_XGB, which introduces an SNP-PRS fusion architecture and employs XGBoost to capture nonlinear interactions among multi-source genetic features. By integrating raw SNP data with multi-trait PRS, the proposed framework significantly improves risk prediction performance for complex diseases. Validation across 18 diseases in the UK Biobank demonstrates consistent performance gains over traditional PRS-based methods. This study overcomes the linear modeling limitations of conventional PRS approaches and provides a new paradigm for nonlinear integration of SNPs and multi-trait PRS, offering a robust and interpretable tool for personalized genetic risk prediction in precision medicine. -
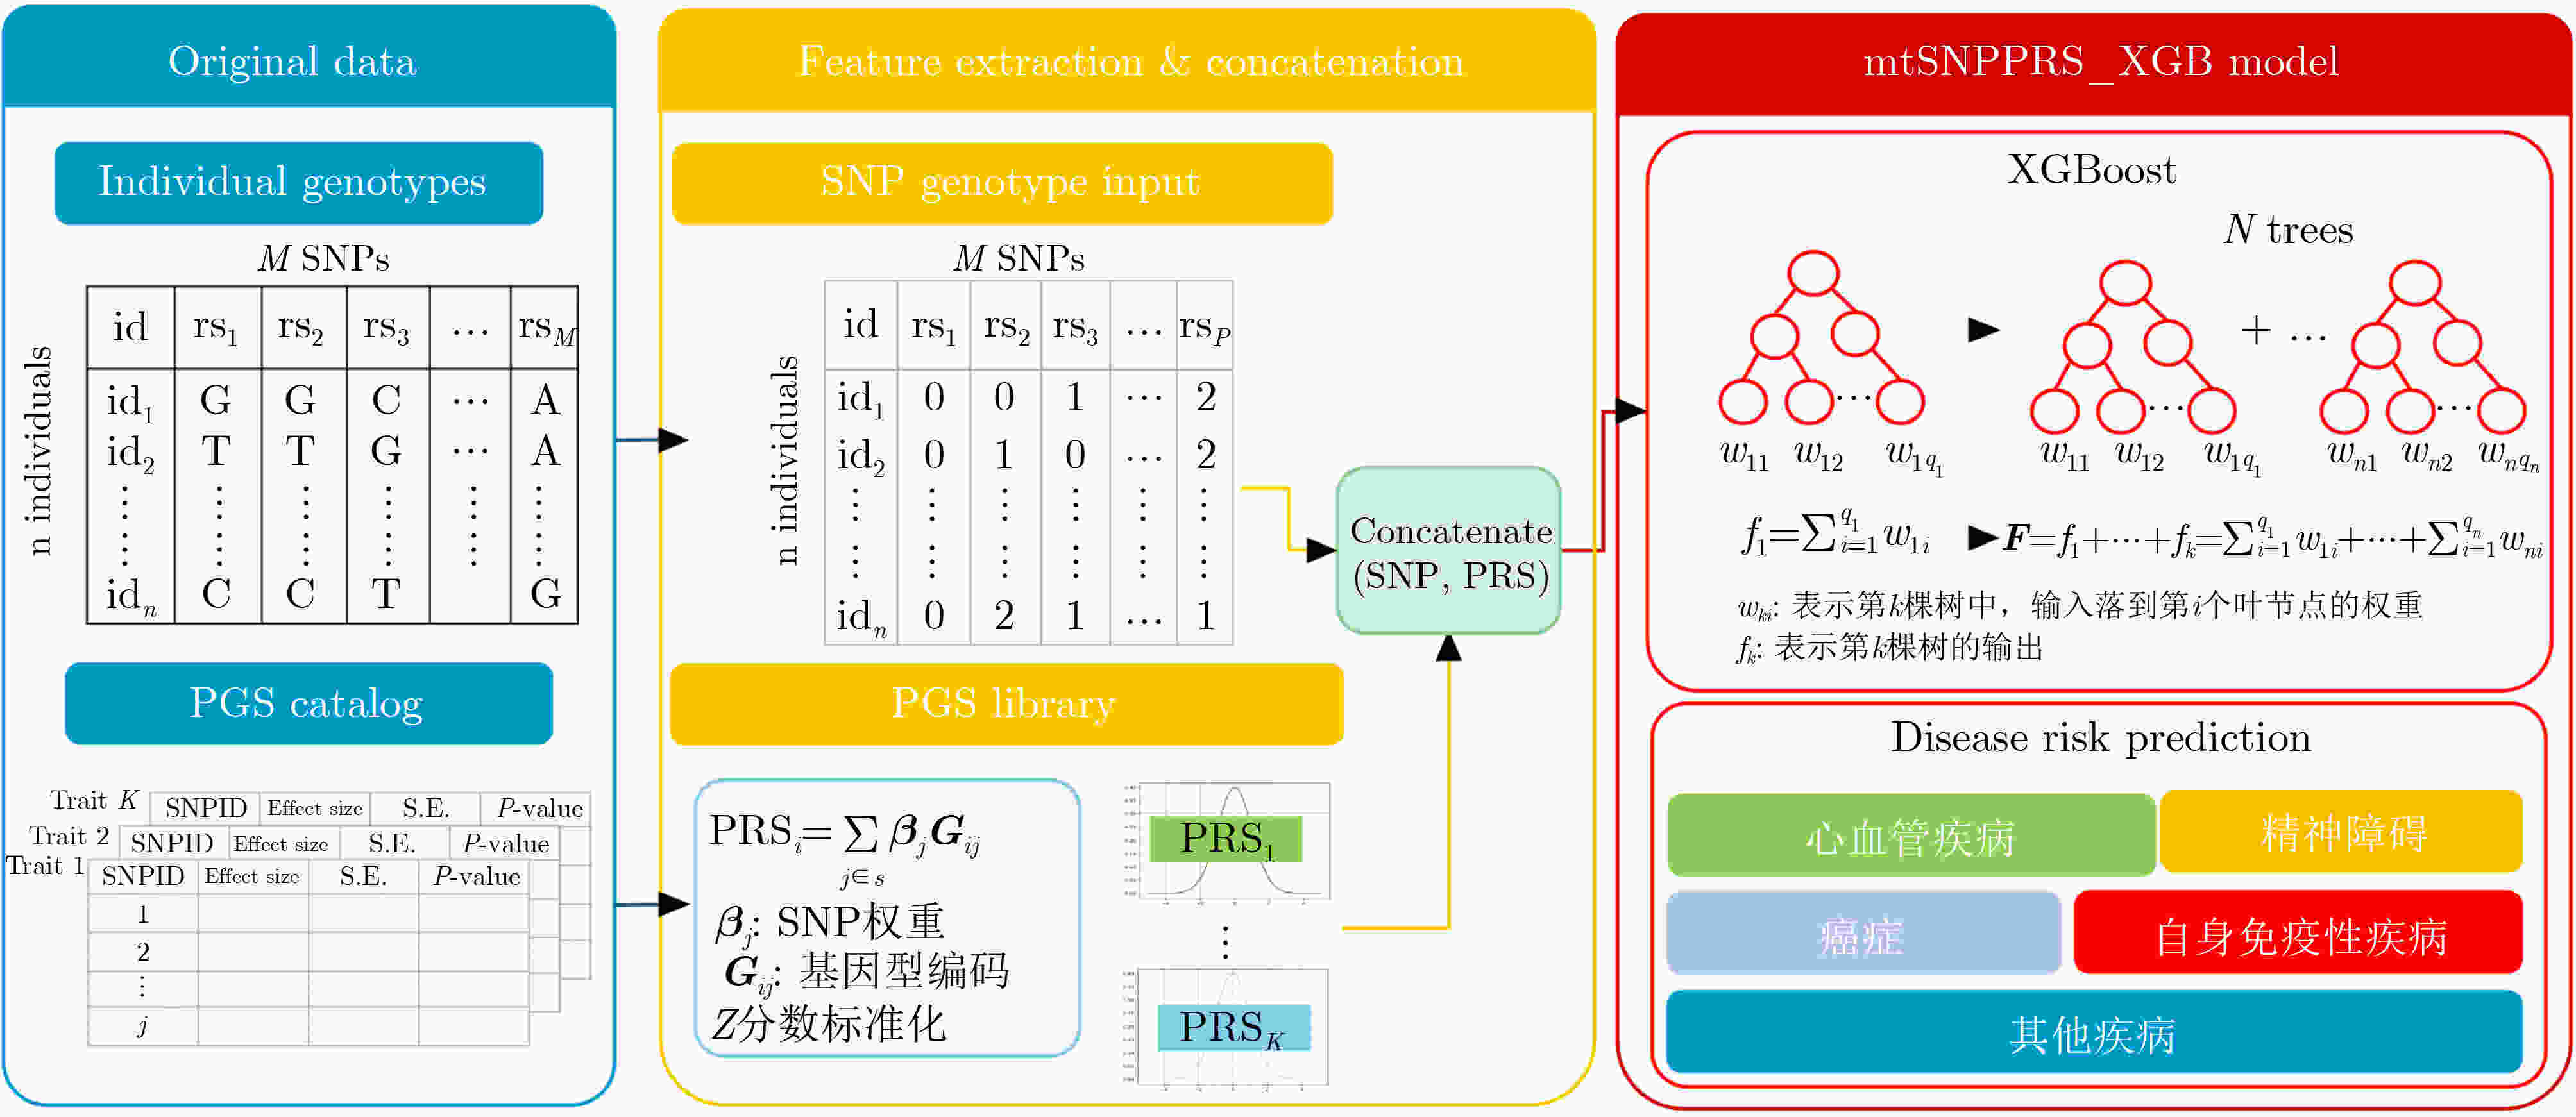
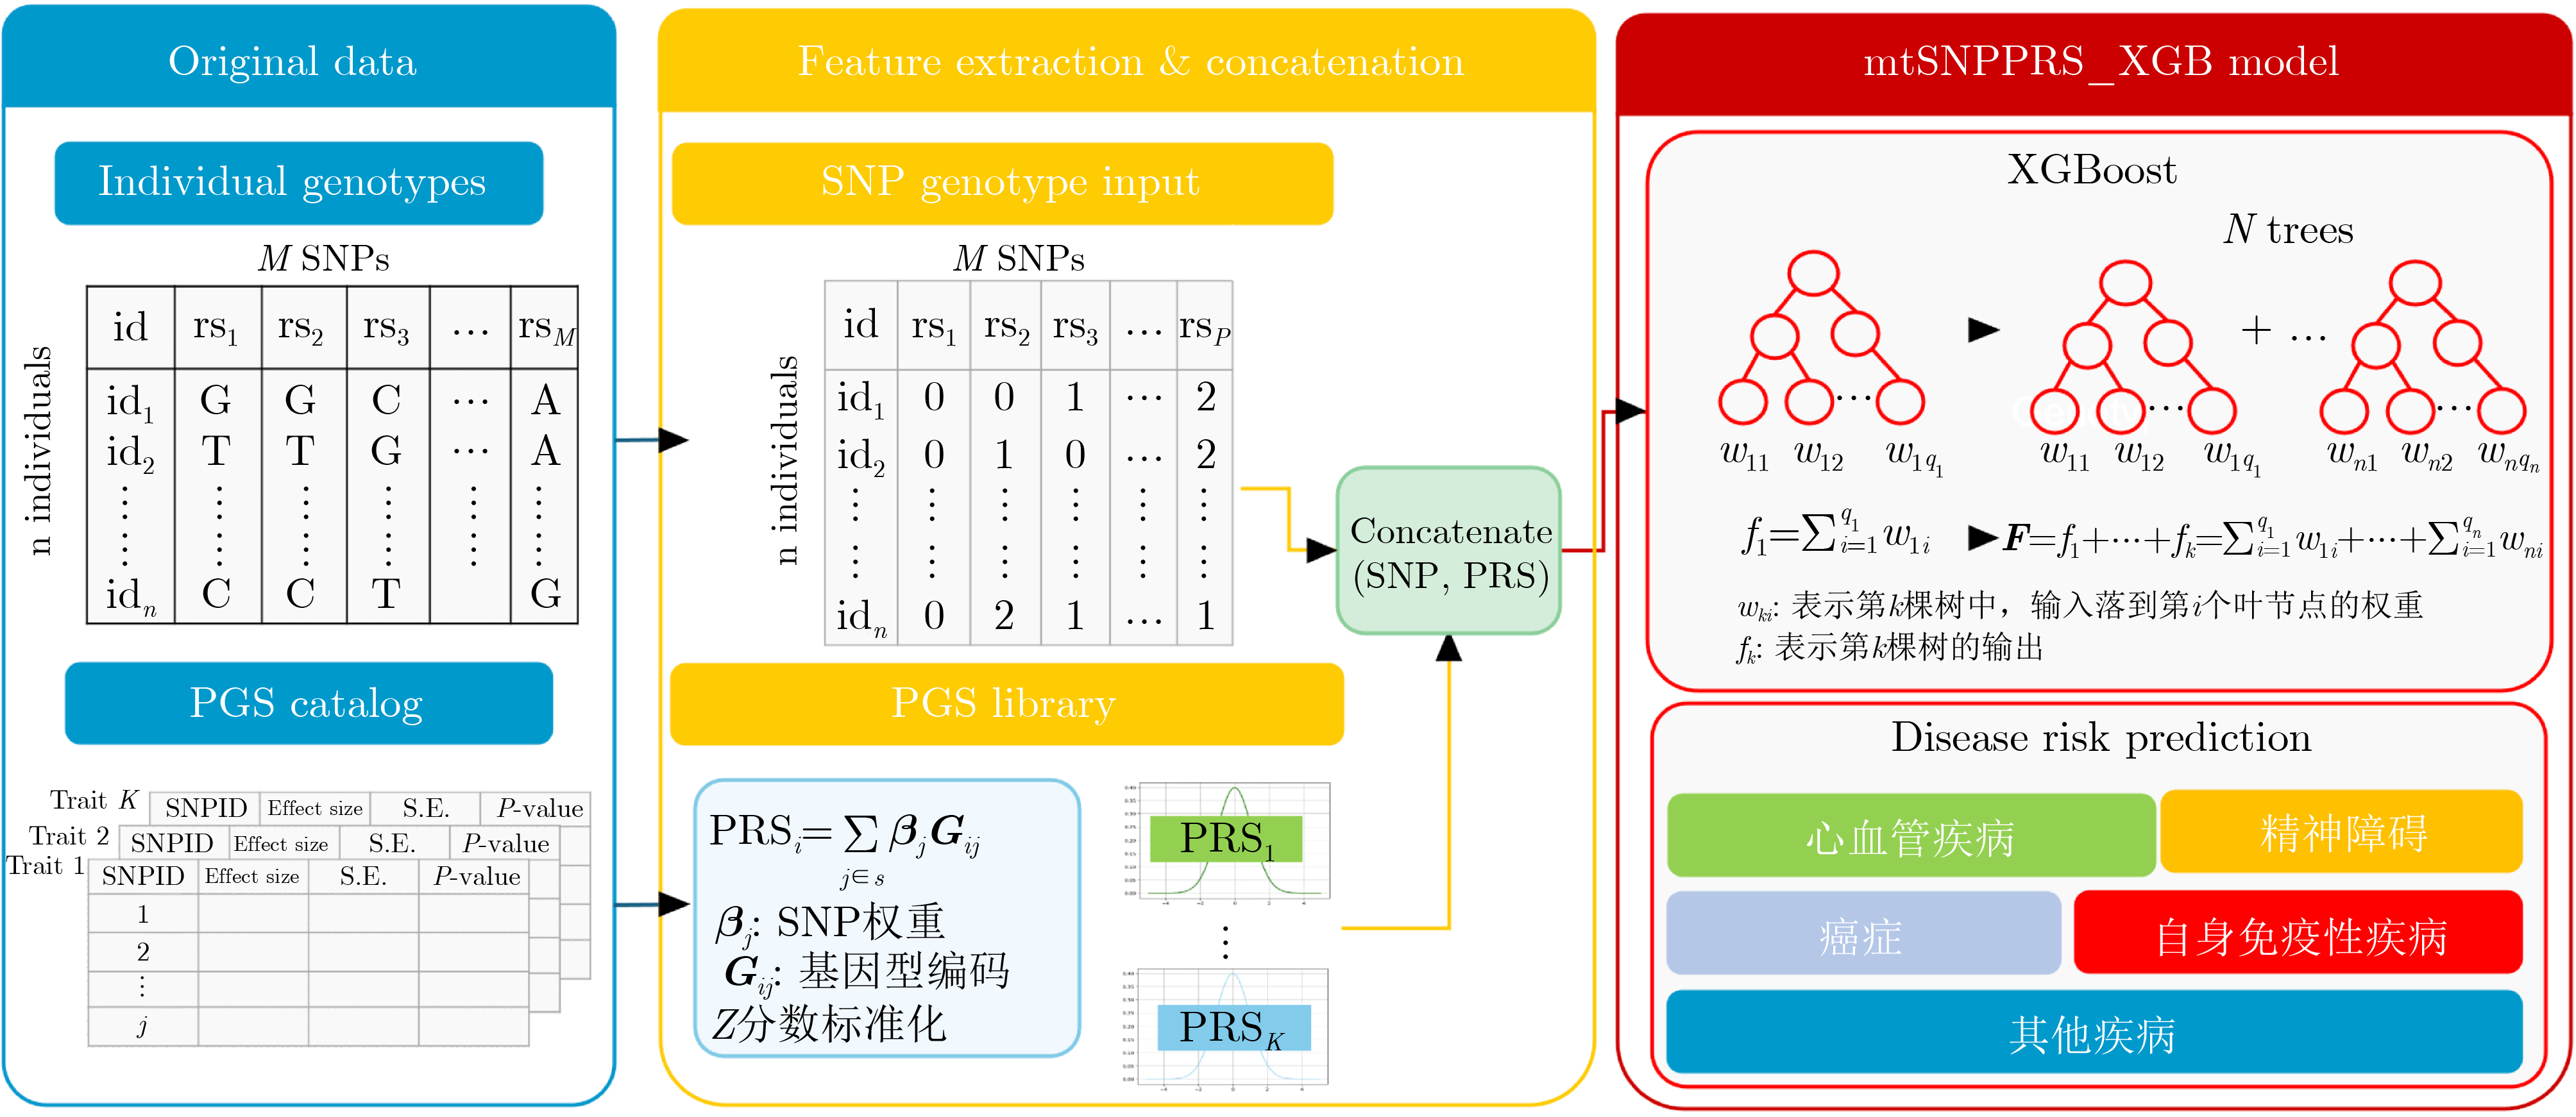
图 1 mtSNPPRS_XGB模型的创新框架
注:在SNP特征提取阶段,从GWAS Catalog中选取与目标性状显著相关的SNP位点;在PRS特征提取阶段,利用PGS Catalog计算多个相关性状的多基因风险评分(PRS),以整合不同性状间的共享遗传信息;在分类决策阶段,将SNP特征与PRS特征进行融合拼接,并采用XGBoost模型对组合后的特征进行全局建模,以提升遗传风险预测的准确性。
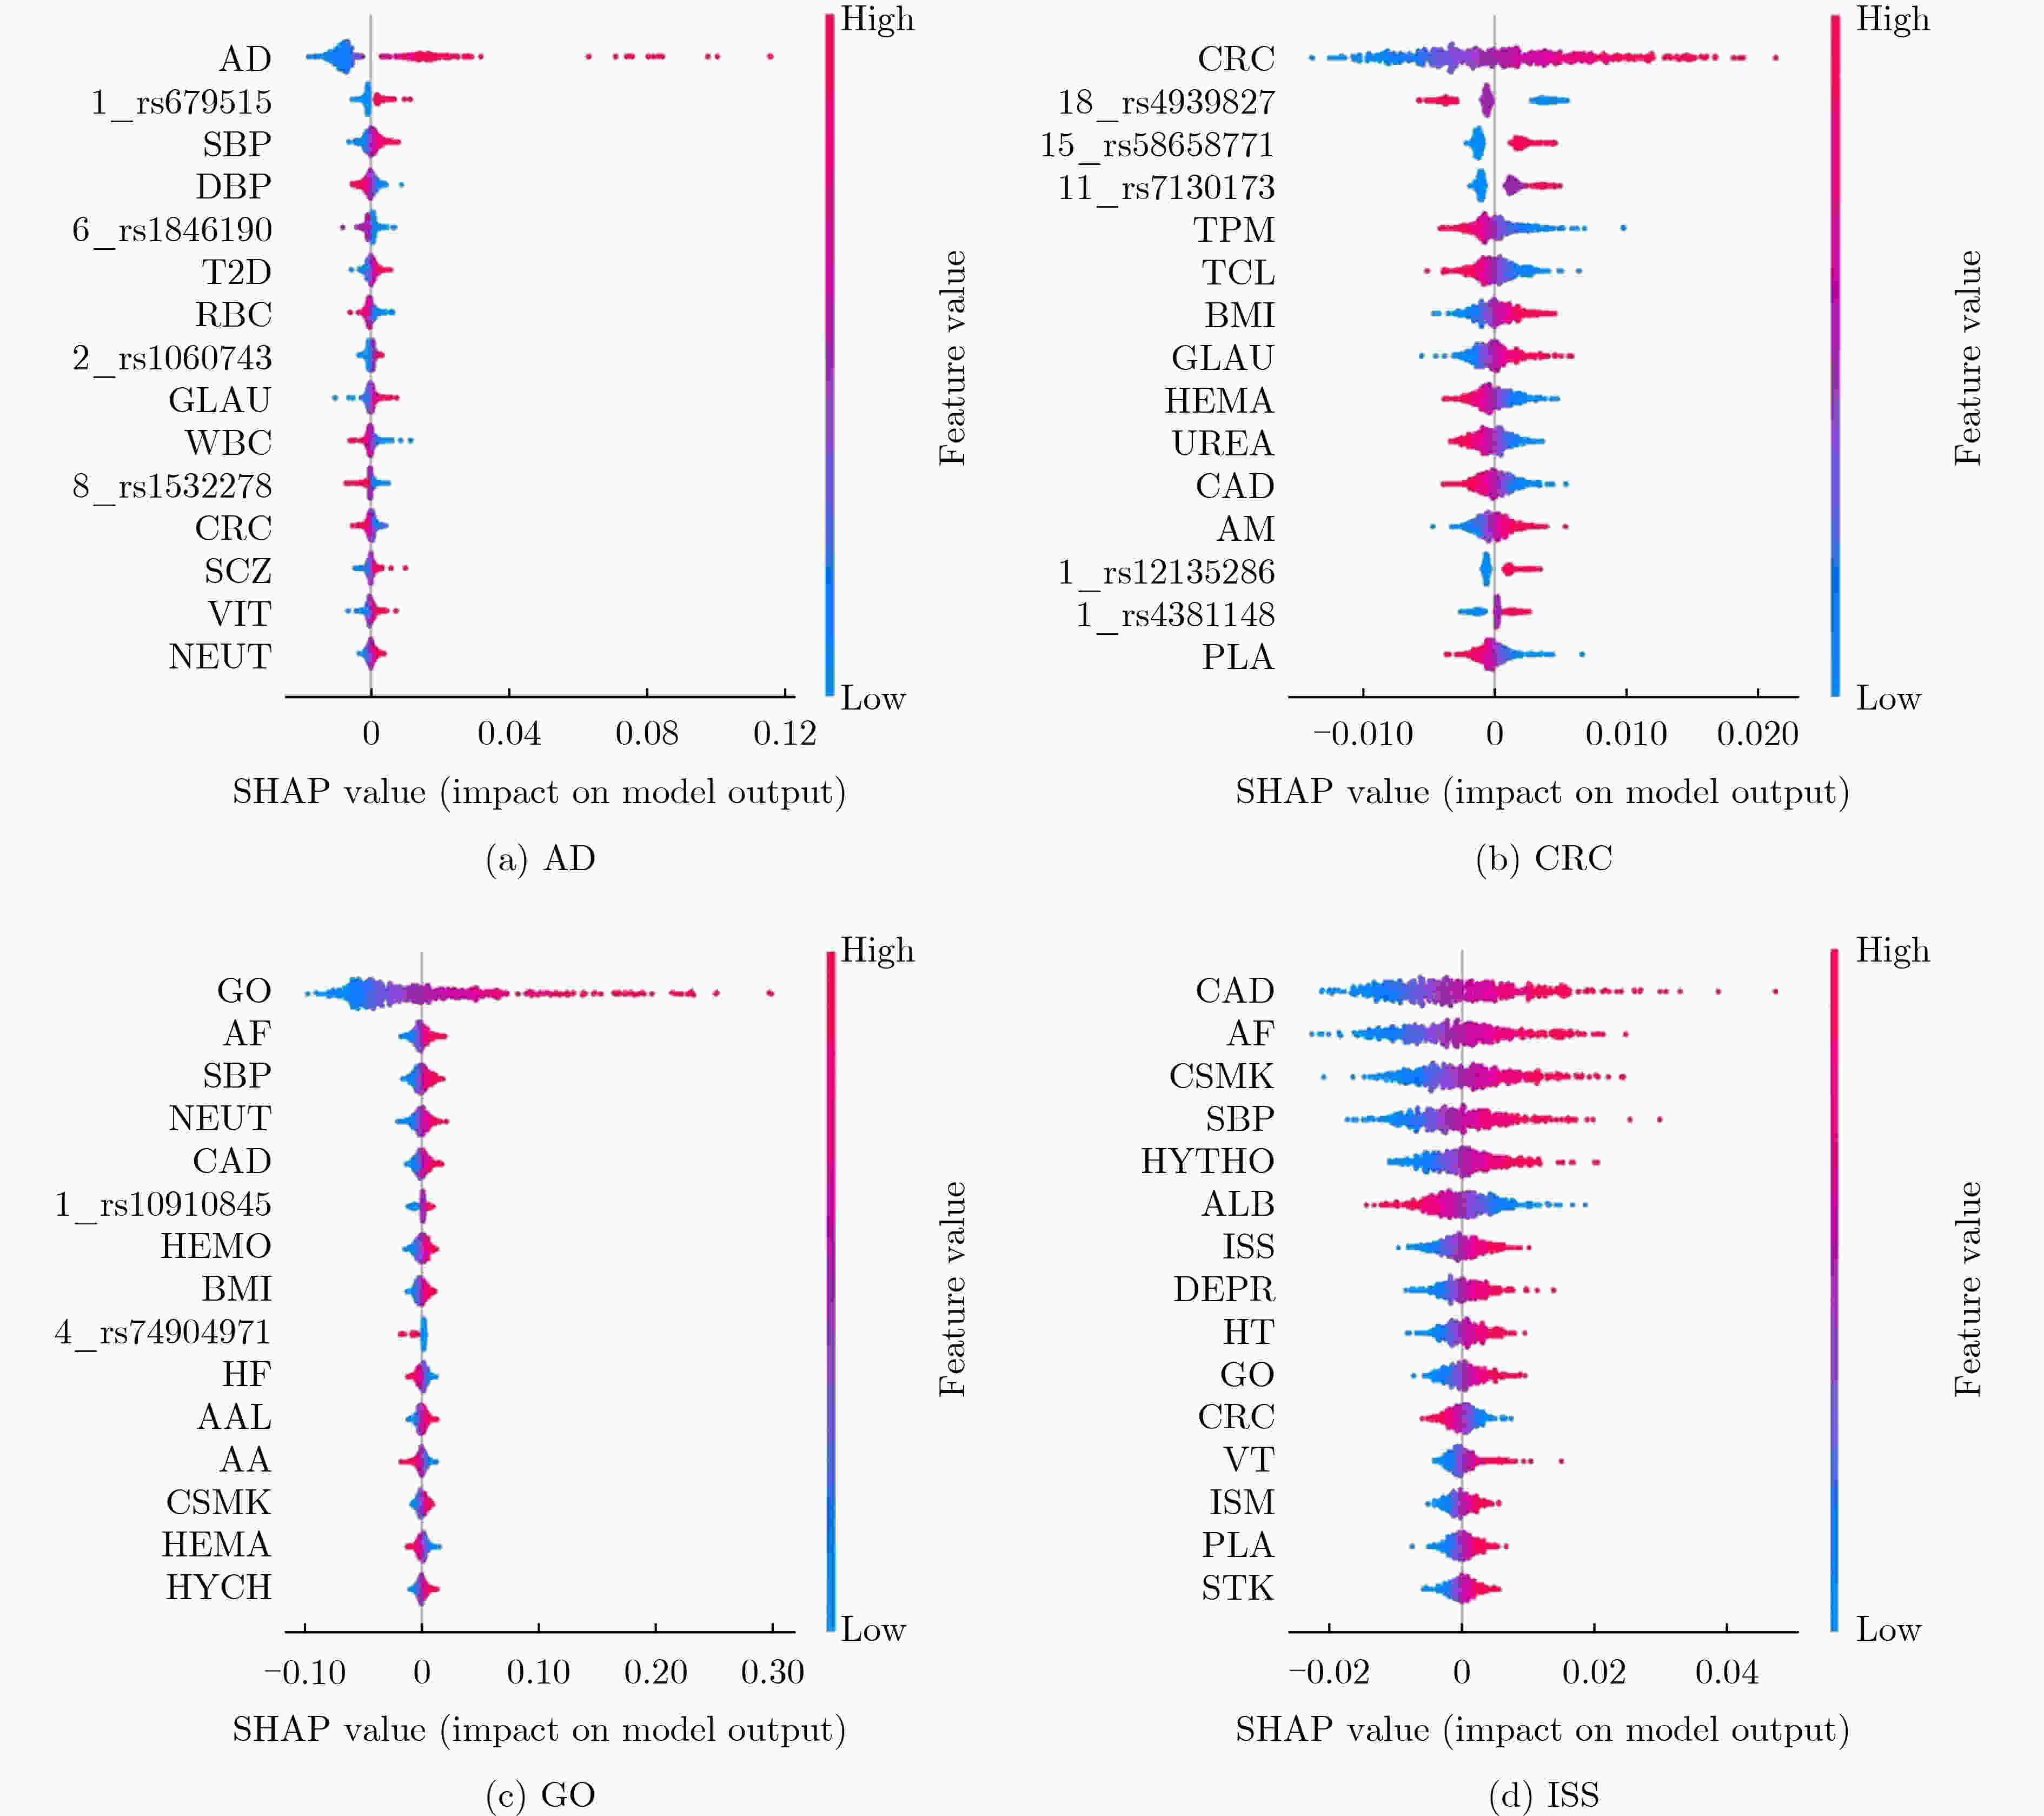
图 6 4种疾病模型中SHAP最高的15个特征的蜂群图
每个点代表一个样本,横轴表示SHAP值,纵轴表示特征名称。点的颜色从蓝到红表示特征值从低到高,颜色越红表示该特征值越大。点的分布越分散表示该特征对不同样本的影响差异越大。SHAP值为正表示该特征增加疾病风险,为负则表示降低疾病风险。
表 1 18种疾病的基本信息
疾病名称 缩写 中文名 ICD 10 正样本数 SNP数量 Coronary Artery Disease CAD 冠心病 I21,I22,I23,
I24.1,I25.239,523 1548 Heart Failure HF 心衰 I50 14,411 173 Ischaemic Stroke ISS 缺血性卒中 I63,I64 12,165 159 Alzheimer’s Disease AD 阿尔兹海默病 F00,G30 3,077 63 Parkinson’s Disease PD 帕金森病 G20 3,145 355 Bipolar Disorder BD 双相情感障碍 F31 1,689 862 Breast Cancer BC 乳腺癌 C50 12,694 884 Colorectal Carcinoma CRC 结直肠癌 C18,C19,C20 7,027 44 Skin Cancer SKC 皮肤癌 C44 19,143 538 Rheumatoid Arthritis RA 类风湿关节炎 M05,M06,
M08.08,835 1888 Psoriasis PSO 银屑病 L40 10,865 515 Systemic Lupus Erythematosus SLE 系统性红斑狼疮 M32 650 784 Gout GO 痛风 M10 14,220 134 Celiac Disease CED 乳糜泻 K90.0 2,455 153 Asthma AST 哮喘 J45,J46 49,477 1241 Type 2 Diabetes Mellitus T2D 2型糖尿病 E11 29,024 2131 Non-alcoholic Fatty Liver Disease NAFL 非酒精性脂肪肝 K76.0 4,931 205 Glaucoma GLAU 青光眼 H40 14,143 701  下载: 导出CSV
表 2 不同类别疾病下的各方法AUC性能对比(%)
疾病类别 方法 平均AUC 95%
Lower CI95%
Upper CI心血管疾病 mtPRS_XGB 64.60 64.50 64.70 mtPRS_ML 64.83 64.76 64.90 UniPRS 58.41 58.41 58.41 mtSNPPRS_XGB 64.90 64.79 64.99 自身免疫疾病 mtPRS_XGB 65.30 64.96 65.63 mtPRS_ML 66.07 65.83 66.33 UniPRS 63.14 63.14 63.14 mtSNPPRS_XGB 68.89 68.53 69.23 癌症 mtPRS_XGB 61.52 61.35 61.67 mtPRS_ML 61.91 61.82 62.01 UniPRS 61.43 61.42 61.44 mtSNPPRS_XGB 62.77 62.60 62.94 精神类疾病 mtPRS_XGB 62.91 62.60 63.22 mtPRS_ML 63.67 63.50 63.81 UniPRS 62.93 62.93 62.93 mtSNPPRS_XGB 63.51 63.12 63.97 其他疾病 mtPRS_XGB 69.76 69.71 69.81 mtPRS_ML 70.08 70.06 70.10 UniPRS 64.38 64.38 64.38 mtSNPPRS_XGB 70.67 70.52 70.81
下载: 导出CSV
-
[1] CLAUSSNITZER M, CHO J H, COLLINS R, et al. A brief history of human disease genetics[J]. Nature, 2020, 577(7789): 179–189. doi: 10.1038/s41586-019-1879-7. [2] MA Ying and ZHOU Xiang. Genetic prediction of complex traits with polygenic scores: A statistical review[J]. Trends in Genetics, 2021, 37(11): 995–1011. doi: 10.1016/j.tig.2021.06.004. [3] ZHANG Sai, SHU Hantao, ZHOU Jingtian, et al. Single-cell polygenic risk scores dissect cellular and molecular heterogeneity of complex human diseases[J]. Nature Biotechnology, 2025: 1–17. doi: 10.1038/s41587-025-02725-6. [4] LENNON N J, KOTTYAN L C, KACHULIS C, et al. Selection, optimization and validation of ten chronic disease polygenic risk scores for clinical implementation in diverse US populations[J]. Nature Medicine, 2024, 30(2): 480–487. doi: 10.1038/s41591-024-02796-z. [5] LOOS R J F. 15 years of genome-wide association studies and no signs of slowing down[J]. Nature Communications, 2020, 11(1): 5900. doi: 10.1038/s41467-020-19653-5. [6] ZHU Wensheng and ZHANG Heping. Why do we test multiple traits in genetic association studies?[J]. Journal of the Korean Statistical Society, 2009, 38(1): 1–10. doi: 10.1016/j.jkss.2008.10.006. [7] HU Yiming, LU Qiongshi, LIU Wei, et al. Joint modeling of genetically correlated diseases and functional annotations increases accuracy of polygenic risk prediction[J]. PLoS Genetics, 2017, 13(6): e1006836. doi: 10.1371/journal.pgen.1006836. [8] GUO Ping, GONG Weiming, LI Yuanming, et al. Pinpointing novel risk loci for Lewy body dementia and the shared genetic etiology with Alzheimer’s disease and Parkinson’s disease: A large-scale multi-trait association analysis[J]. BMC Medicine, 2022, 20(1): 214. doi: 10.1186/s12916-022-02404-2. [9] VILHJÁLMSSON B J, YANG Jian, FINUCANE H K, et al. Modeling linkage disequilibrium increases accuracy of polygenic risk scores[J]. American Journal of Human Genetics, 2015, 97(4): 576–592. doi: 10.1016/j.ajhg.2015.09.001. [10] GE Tian, CHEN C Y, NI Yang, et al. Polygenic prediction via Bayesian regression and continuous shrinkage priors[J]. Nature Communications, 2019, 10(1): 1776. doi: 10.1038/s41467-019-09718-5. [11] KHERA A V, CHAFFIN M, ARAGAM K G, et al. Genome-wide polygenic scores for common diseases identify individuals with risk equivalent to monogenic mutations[J]. Nature Genetics, 2018, 50(9): 1219–1224. doi: 10.1038/s41588-018-0183-z. [12] MAVADDAT N, MICHAILIDOU K, DENNIS J, et al. Polygenic risk scores for prediction of breast cancer and breast cancer subtypes[J]. American Journal of Human Genetics, 2019, 104(1): 21–34. doi: 10.1016/j.ajhg.2018.11.002. [13] PRIVÉ F, ARBEL J, and VILHJÁLMSSON B J. LDpred2: Better, faster, stronger[J]. Bioinformatics, 2021, 36(22/23): 5424–5431. doi: 10.1093/bioinformatics/btaa1029. [14] ZHONG Peng, ZHANG Chumeng, WU Qinfeng, et al. Shared genetic loci connect cardiovascular disease with blood pressure and lipid traits in East Asian populations[J]. Frontiers in Genetics, 2025, 16: 1635378. doi: 10.3389/fgene.2025.1635378. [15] ALLEGRINI A G, SELZAM S, RIMFELD K, et al. Genomic prediction of cognitive traits in childhood and adolescence[J]. Molecular Psychiatry, 2019, 24(6): 819–827. doi: 10.1038/s41380-019-0394-4. [16] KRAPOHL E, PATEL H, NEWHOUSE S, et al. Multi-polygenic score approach to trait prediction[J]. Molecular Psychiatry, 2018, 23(5): 1368–1374. doi: 10.1038/mp.2017.163. [17] CHUNG W, CHEN Jun, TURMAN C, et al. Efficient cross-trait penalized regression increases prediction accuracy in large cohorts using secondary phenotypes[J]. Nature Communications, 2019, 10(1): 569. doi: 10.1038/s41467-019-08535-0. [18] ALBIÑANA C, ZHU Zhihong, SCHORK A J, et al. Multi-PGS enhances polygenic prediction by combining 937 polygenic scores[J]. Nature Communications, 2023, 14(1): 4702. doi: 10.1038/s41467-023-40330-w. [19] TRUONG B, HULL L E, RUAN Yunfeng, et al. Integrative polygenic risk score improves the prediction accuracy of complex traits and diseases[J]. Cell Genomics, 2024, 4(4): 100523. doi: 10.1016/j.xgen.2024.100523. [20] CHEN T H, CHATTERJEE N, LANDI M T, et al. A penalized regression framework for building polygenic risk models based on summary statistics from genome-wide association studies and incorporating external information[J]. Journal of the American Statistical Association, 2021, 116(533): 133–143. doi: 10.1080/01621459.2020.1764849. [21] ZHAI Song, GUO Bin, WU Baolin, et al. Integrating multiple traits for improving polygenic risk prediction in disease and pharmacogenomics GWAS[J]. Briefings in Bioinformatics, 2023, 24(4): bbad181. doi: 10.1093/bib/bbad181. [22] 王宇翱, 黄叶琪, 李青远, 等. 融合表示学习和知识图谱推理的糖尿病及并发症预测方法[J]. 电子与信息学报. doi: 10.11999/JEIT250798.WANG Yuao, HUANG Yeqi, LI Qingyuan, et al. Integrating representation learning and knowledge graph reasoning for diabetes and complications prediction[J]. Journal of Electronics & Information Technology. doi: 10.11999/JEIT250798. [23] CHEN Tianqi and GUESTRIN C. XGBoost: A scalable tree boosting system[C]. The 22nd ACM SIGKDD International Conference on Knowledge Discovery and Data Mining, San Francisco, USA, 2016: 785–794. doi: 10.1145/2939672.2939785. [24] LAMBERT S A, WINGFIELD B, GIBSON J T, et al. Enhancing the Polygenic Score Catalog with tools for score calculation and ancestry normalization[J]. Nature Genetics, 2024, 56(10): 1989–1994. doi: 10.1038/s41588-024-01937-x. -

 下载:
下载:


图(6) / 表(2)
计量
- 文章访问数: 368
- HTML全文浏览量: 211
- PDF下载量: 54
- 被引次数: 0
