HyperSpectral Image Classification Based on Spectral Attention Graph Convolutional Network
-
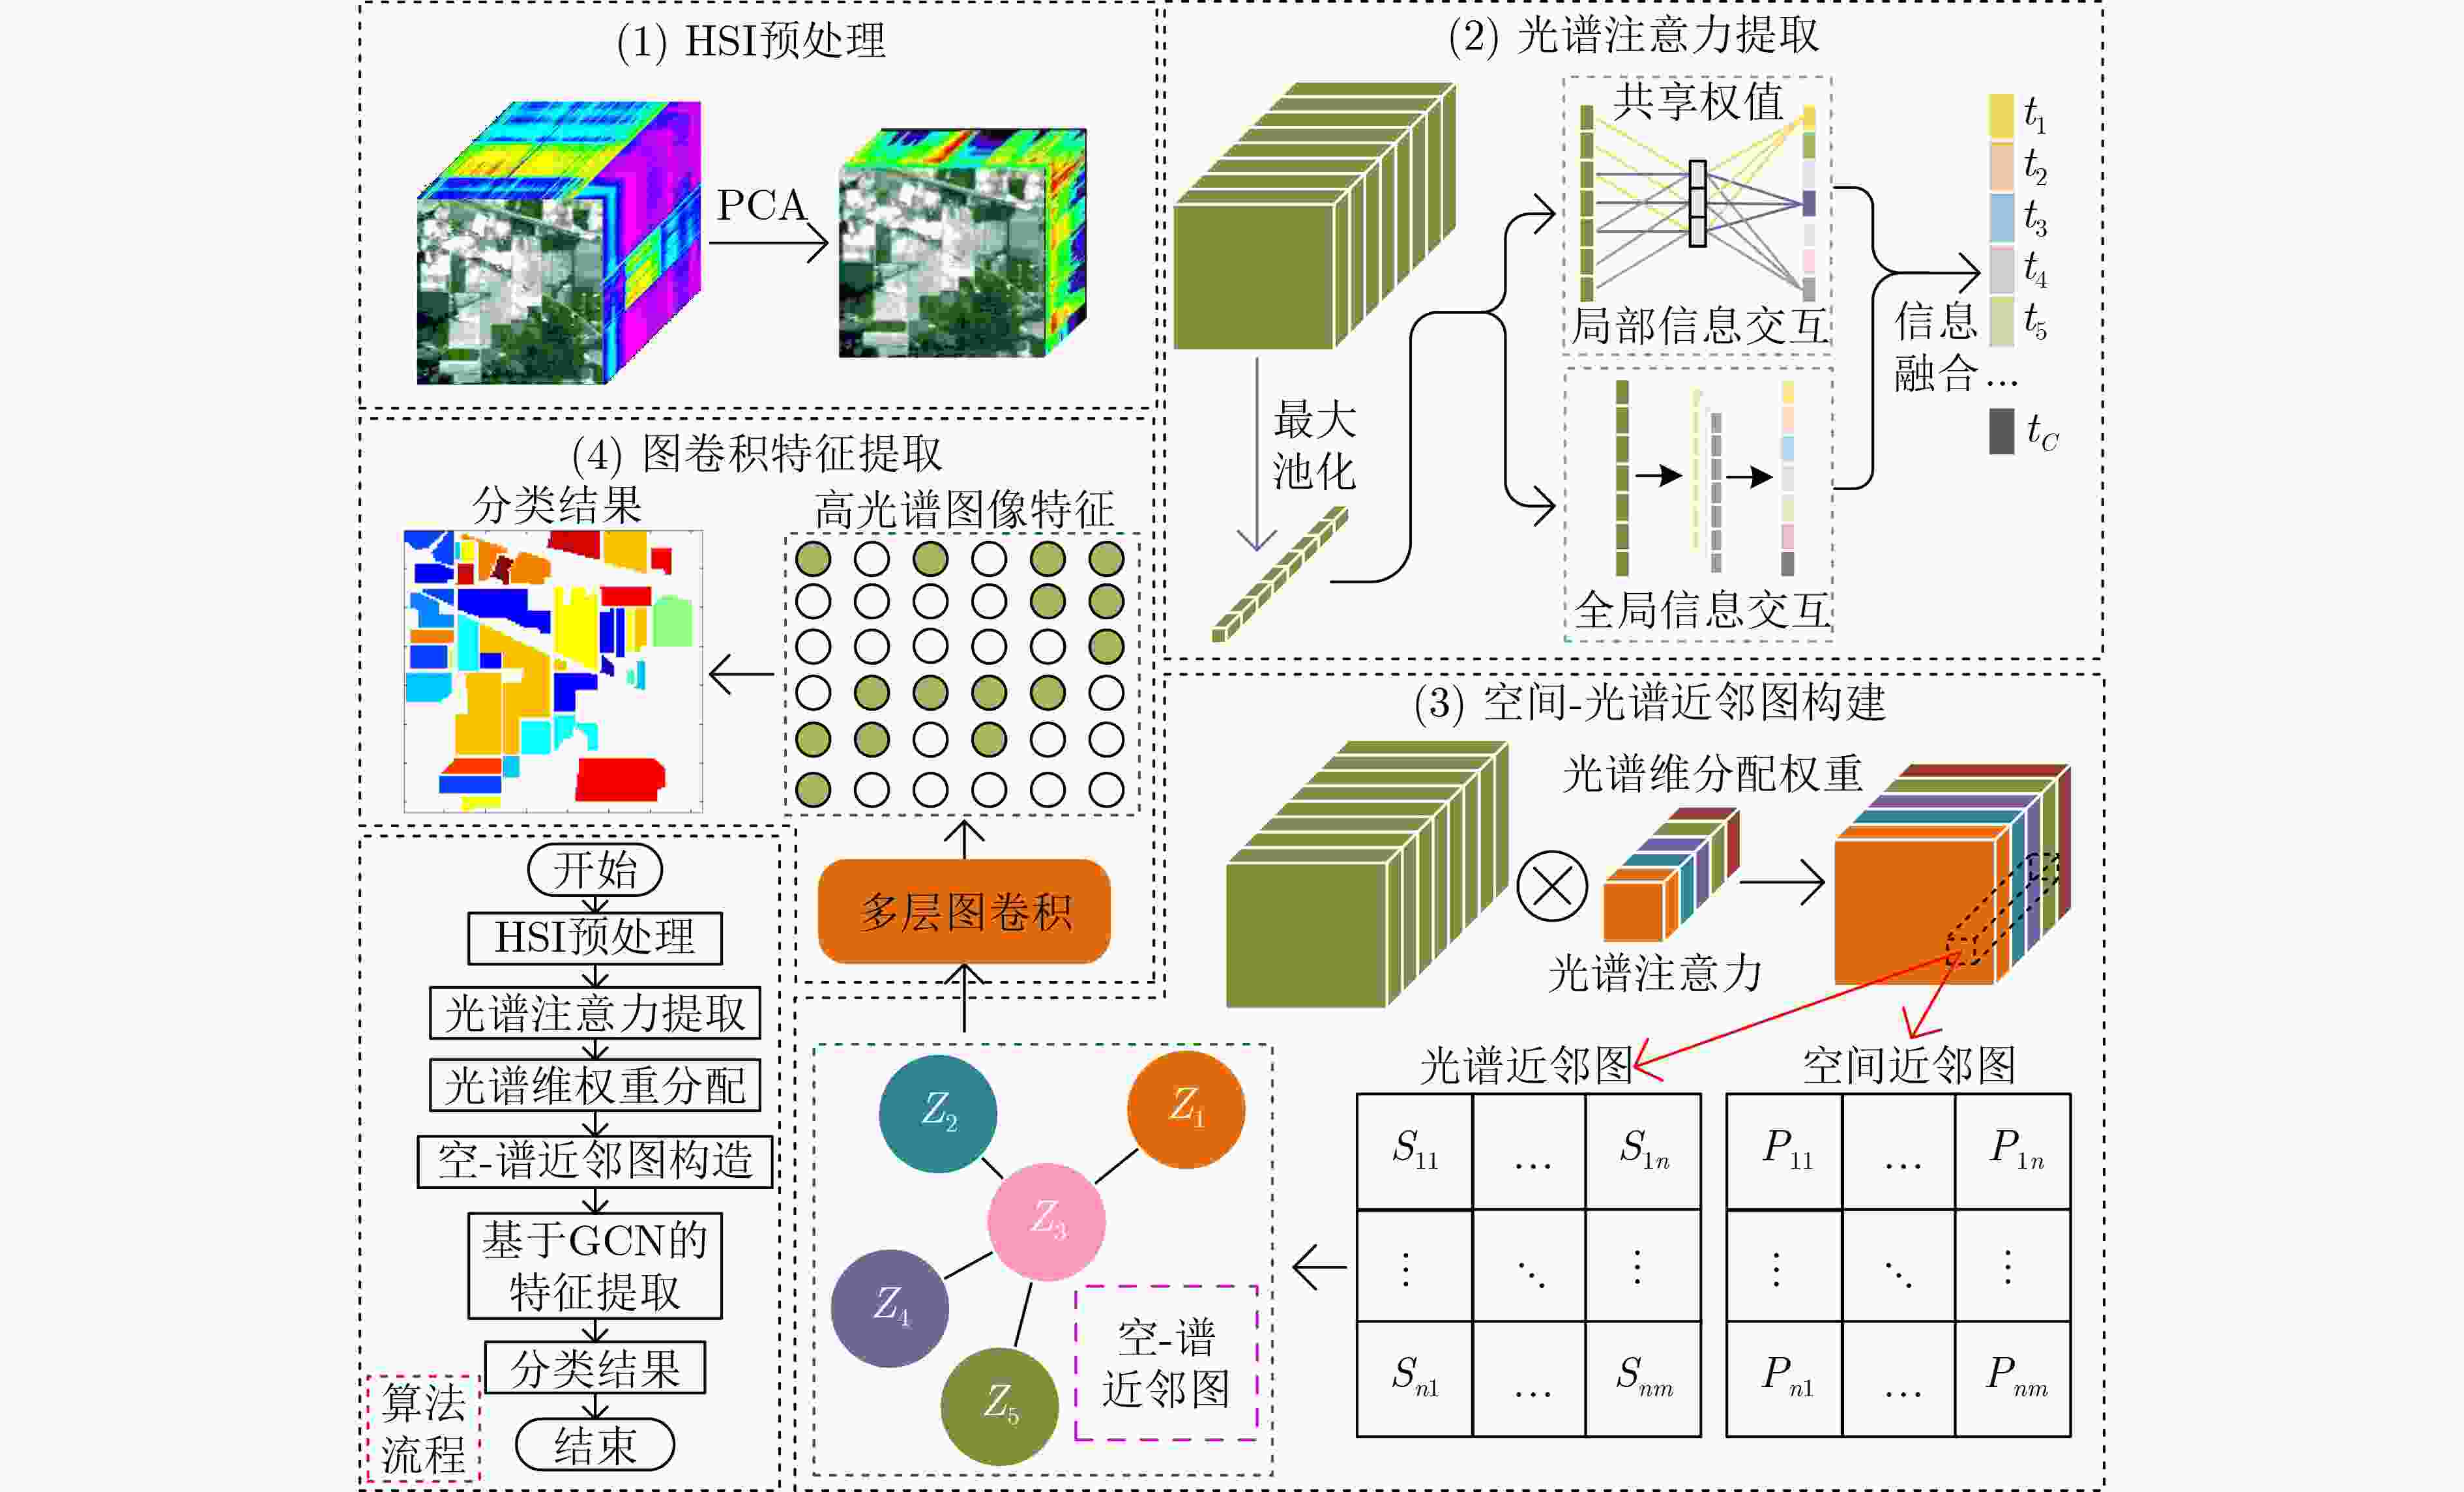
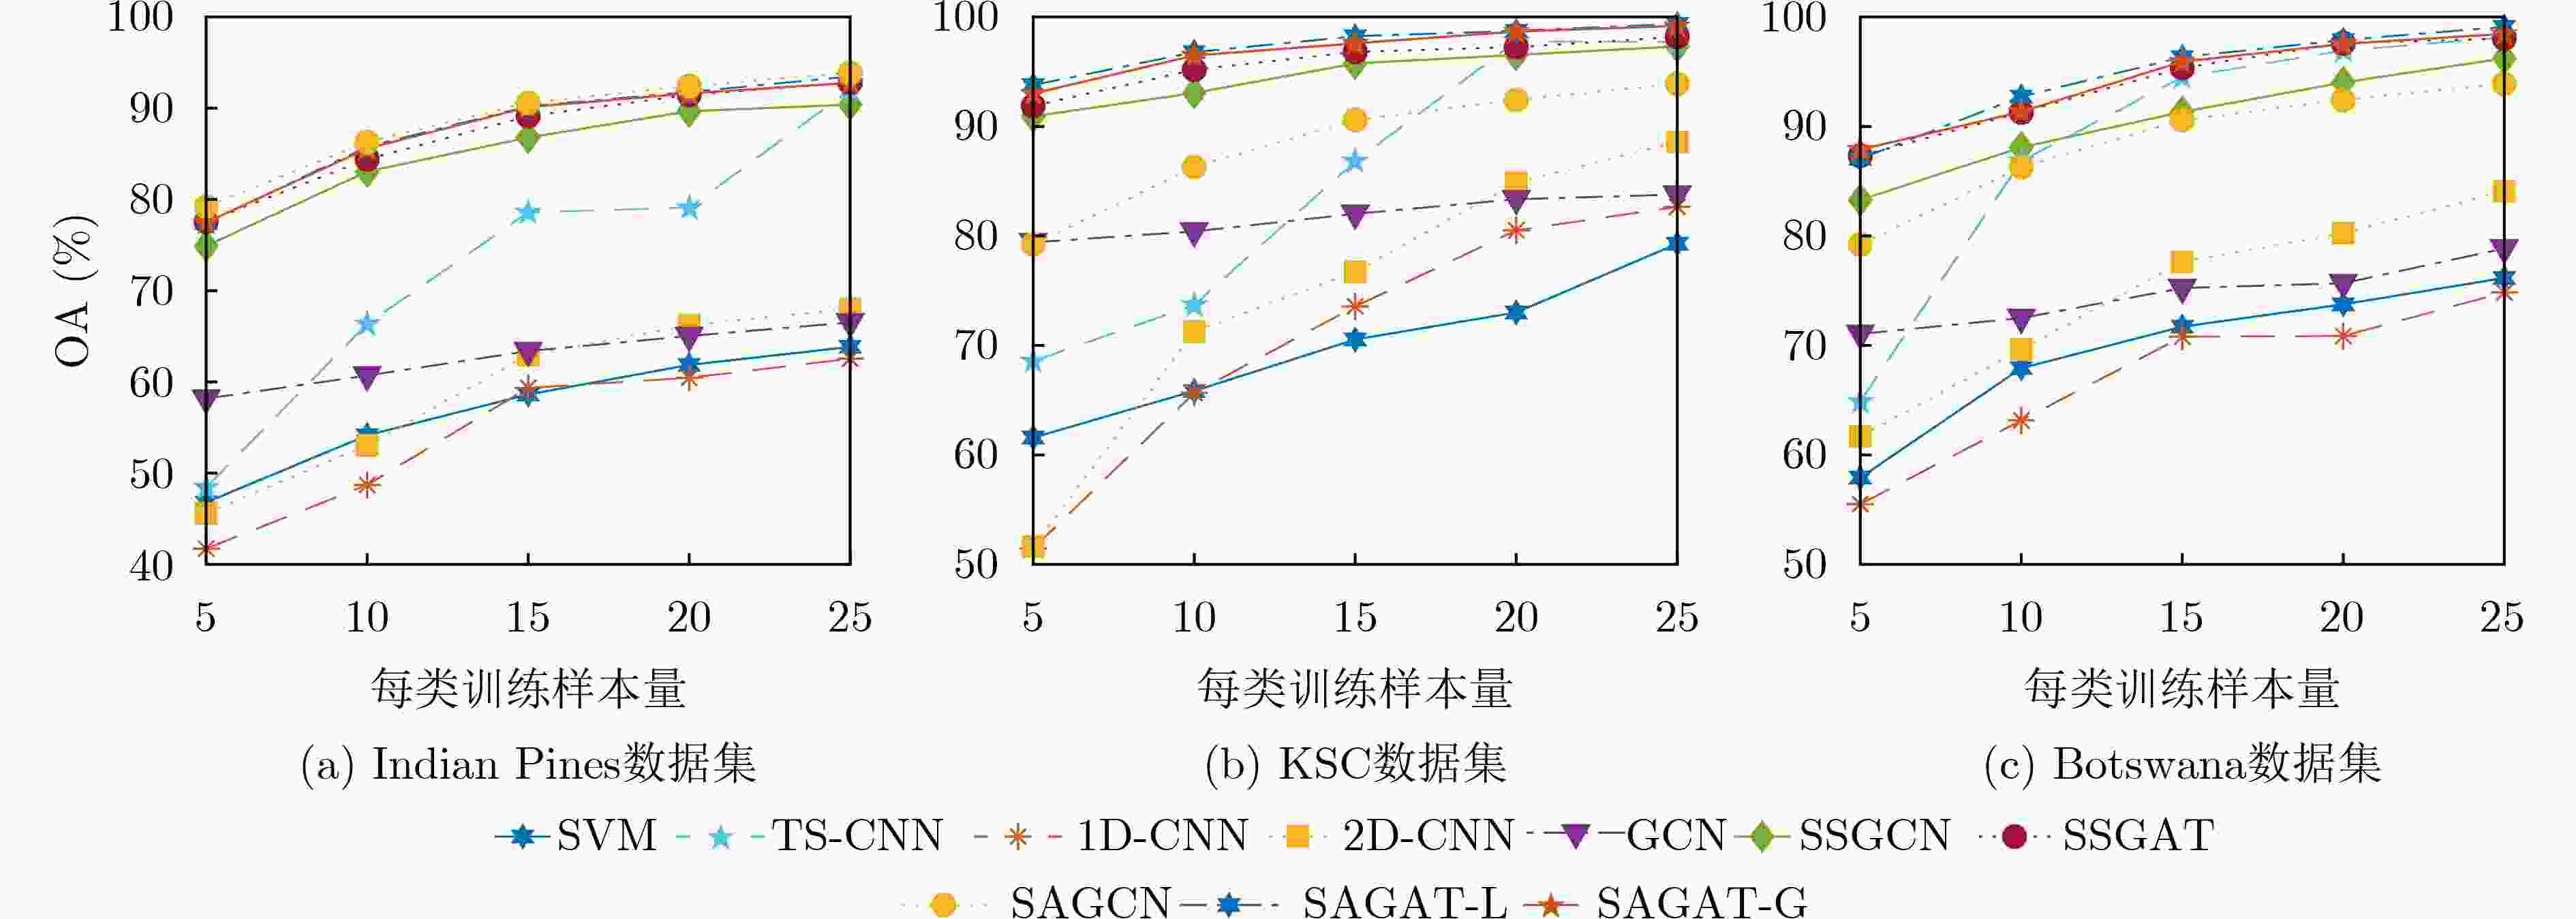
摘要: 近年来,图卷积网络因其特征聚合的机制,能够同时对单个节点以及近邻节点的特征进行表示,被广泛应用于高光谱图像的分类任务。然而,高光谱图像(HSI)中常存在波段冗余、同物异谱等问题,使得直接利用原始光谱特征构建的初始图可靠性不足,从而导致高光谱图像的分类精度低。为此,该文提出一种基于光谱注意力图卷积网络(SAGCN)的高光谱图像半监督分类方法。首先,利用注意力模块对光谱的局部与全局信息进行交互,以增加重要光谱的权重、减小冗余波段以及噪声波段的权重,从而实现光谱的自适应加权;然后,针对光谱加权处理后的高光谱图像,通过空间-光谱相似性度量构建更为准确的近邻矩阵;最后,通过图卷积对标记和无标记样本进行有效的特征聚合,并使用标记样本的聚合特征训练网络。在Indian Pines, Kennedy Space Center和Botswana 3个真实高光谱图像数据集上的实验结果验证了所提方法的有效性。Abstract: In recent years, graph convolutional network has been widely used in hyperspectral image classification because of its feature aggregation mechanism, which can simultaneously represent the features of a single node and neighboring nodes. However, there are many problems in HyperSpectral Images(HSI), such as band redundancy and different spectrum of the same object, which results in the inadequate reliability of the initial graph constructed by directly using the original spectral features, thus leading to the low classification accuracy of hyperspectral images. Therefore, a semi-supervised classification method for hyperspectral images based on Spectral Attention Graph Convolutional Network (SAGCN) is proposed. Firstly, the attention module is used to interact with the local and global information of the spectrum, and realize the adaptive weighting of the spectrum. Then, for the hyperspectral images after spectral weighting, a more accurate nearest neighbor matrix is constructed by using spatial-spectral similarity. Finally, effective feature aggregation of labeled and unlabeled samples is carried out by graph convolution, and the network is trained with the features of labeled samples. Experimental results on three real hyperspectral image datasets including Indian Pines, Kennedy Space Center and Botswana demonstrate the effectiveness of the proposed method.
-
表 1 分类准确率(%)与Kappa系数的对比(Indian Pines数据集)
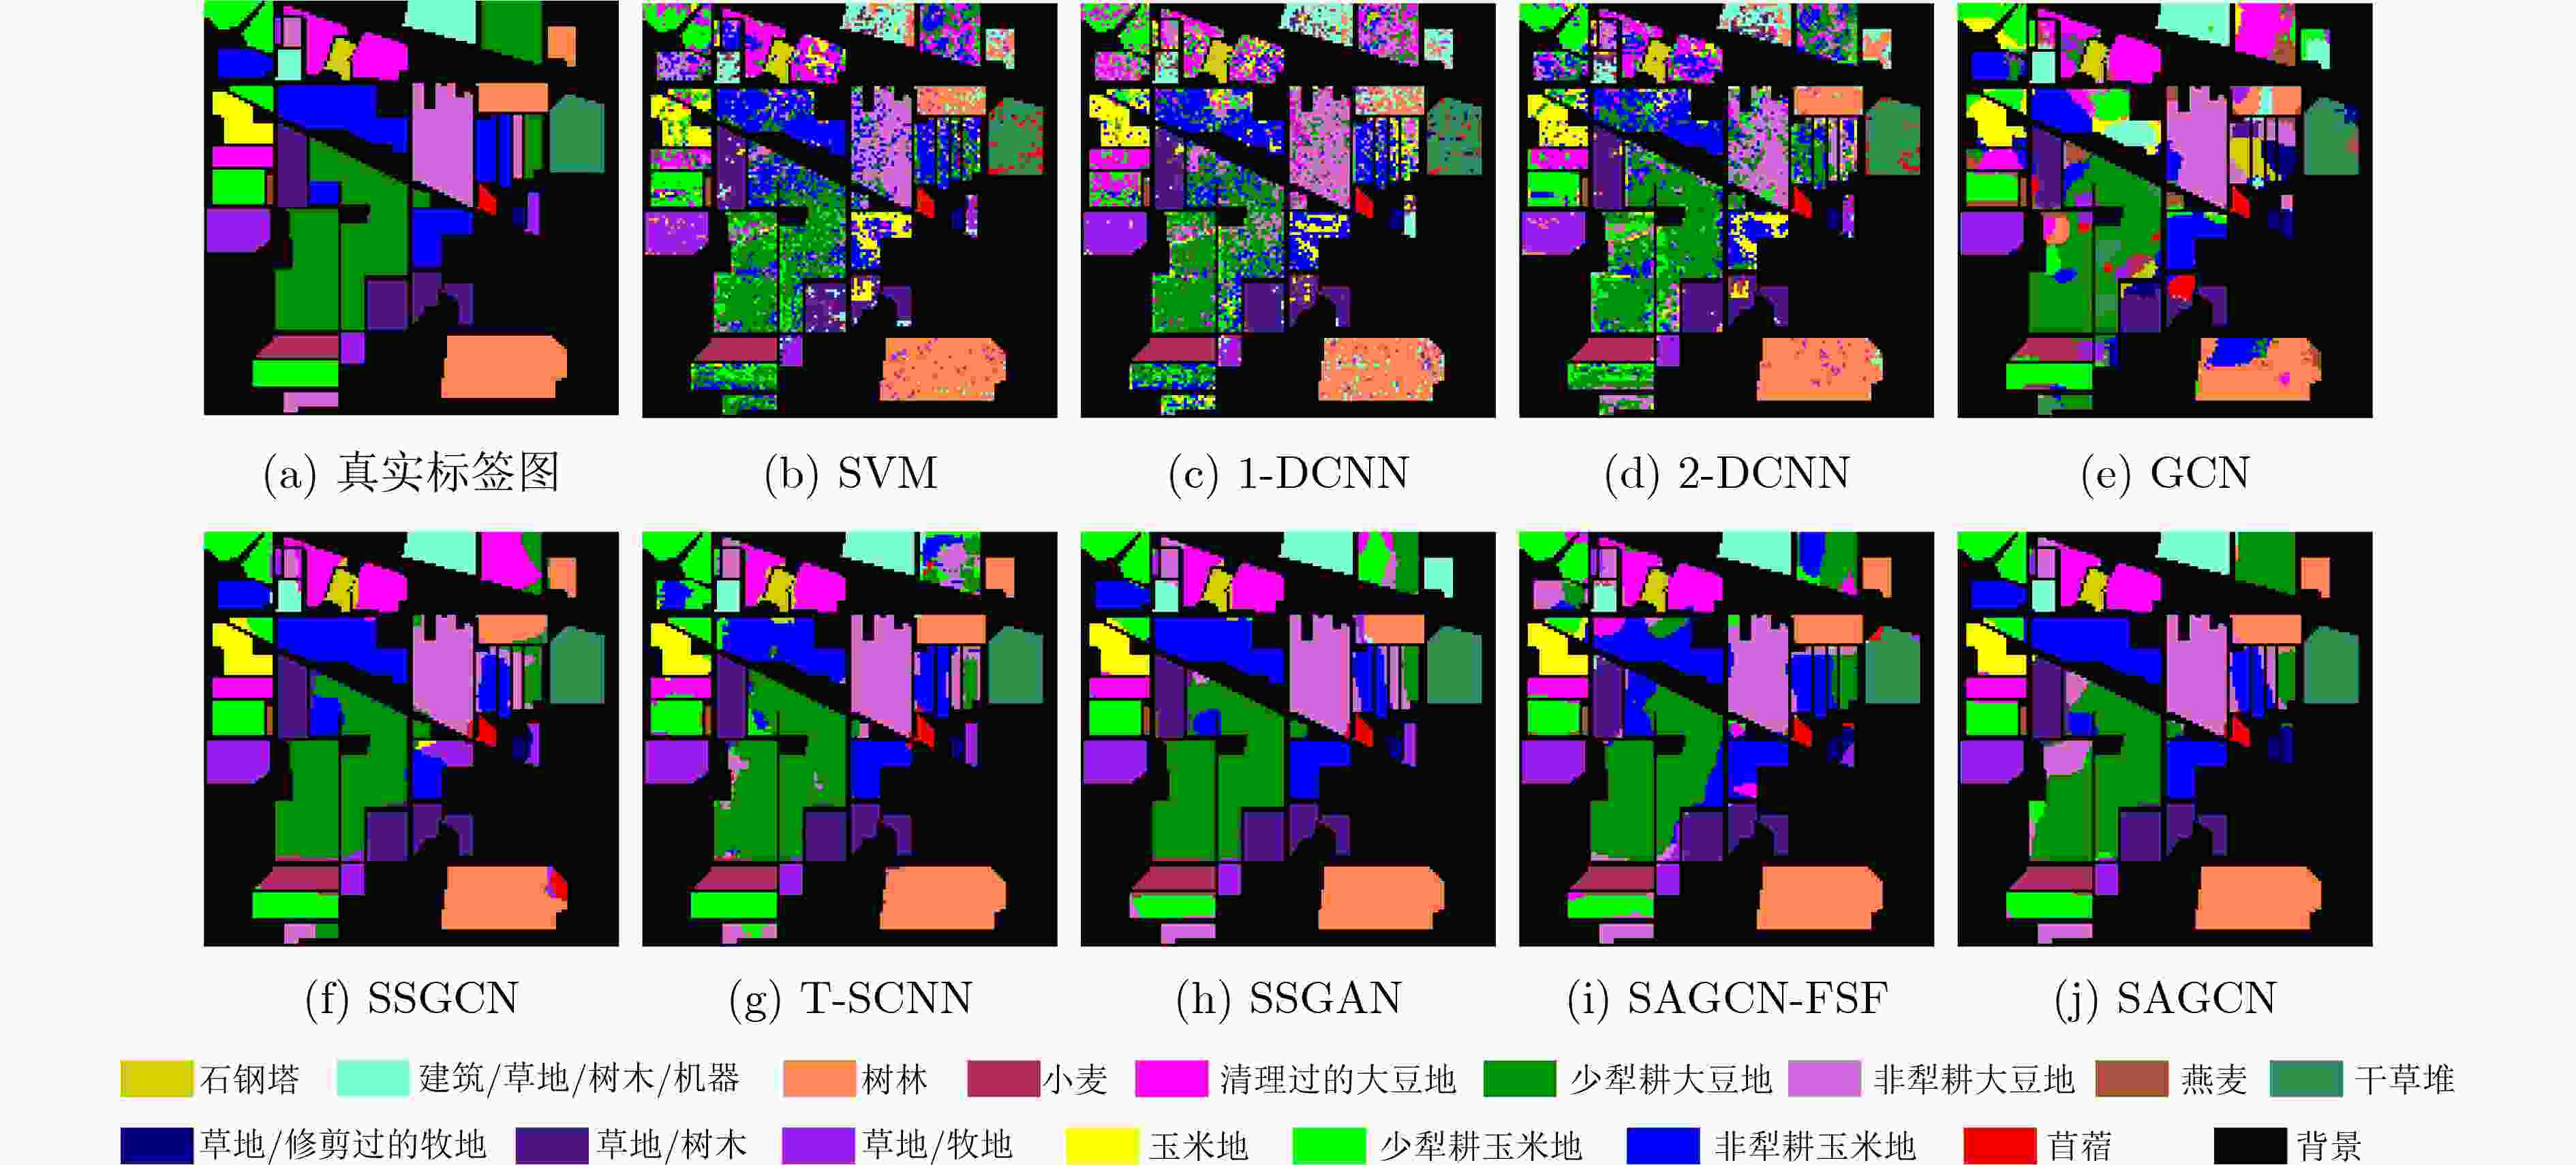
SVM[3] 1-D CNN[18] 2-D CNN[18] GCN[12] SSGCN[13] T-S CNN[7] SSGAN[16] SAGCN-FSF SAGCN 苜蓿 85.71 90.48 95.24 97.50 100.00 100.00 100.00 100.00 100.00 非犁耕玉米地 53.81 56.31 51.39 45.57 85.08 82.97 94.44 81.33 95.44 少犁耕玉米地 57.08 40.50 59.38 78.40 95.30 91.80 90.56 86.09 94.91 玉米地 72.97 82.55 81.13 82.25 100.00 89.62 98.58 98.11 98.11 草地/牧地 81.16 78.38 84.28 69.81 96.07 93.89 99.56 98.69 86.68 草地/树木 91.39 90.35 91.35 76.52 99.59 99.86 98.58 99.57 99.43 草地/修剪过的牧地 96.67 100.00 100.00 100.00 100.00 100.00 100.00 100.00 100.00 干草堆 85.67 86.98 90.29 88.14 100.00 96.69 100.00 98.45 100.00 燕麦 97.00 80.00 100.00 100.00 100.00 100.00 100.00 90.00 100.00 非犁耕大豆地 63.54 59.87 61.77 70.81 90.43 95.88 99.05 88.28 97.04 少犁耕大豆地 46.83 49.55 58.77 54.02 80.29 88.64 86.17 87.08 84.86 清理过的大豆地 56.92 53.70 55.28 75.30 95.78 85.92 94.19 91.90 96.65 小麦 97.78 96.67 98.89 77.89 99.02 100.00 100.00 100.00 100.00 树林 78.05 73.79 89.84 66.16 91.94 98.47 87.26 98.55 99.35 建筑/草地/树木/机器 61.41 63.16 49.86 98.95 98.70 99.72 98.34 99.17 99.17 石钢塔 94.41 97.06 97.06 90.80 100.00 100.00 100.00 100.00 95.59 AA 76.28 74.96 79.03 79.51 95.76 95.21 96.97 94.83 96.70 OA 63.84 62.54 68.00 66.52 90.39 92.03 92.79 91.01 93.89 Kappa 0.5941 0.5807 0.6367 0.6298 0.8816 0.9091 0.9181 0.8975 0.9304 表 2 分类准确率(%)与Kappa系数的对比(KSC数据集)
SVM[3] 1-D CNN[18] 2-D CNN[18] GCN[12] SSGCN[13] T-S CNN[7] SSGAN[16] SAGCN-FSF SAGCN 灌木丛 79.02 72.15 94.94 91.13 100.00 99.46 97.42 98.40 100.00 柳树沼泽 67.92 81.19 86.01 84.81 100.00 98.18 96.33 100.00 100.00 吊床 88.54 86.58 90.29 94.40 100.00 94.85 100.00 100.00 100.00 湿地松 19.28 55.95 77.72 57.32 50.43 89.96 93.39 100.00 100.00 橡树 74.05 49.26 81.98 74.19 82.98 100.00 94.85 81.76 100.00 硬木 80.09 62.25 73.74 47.09 98.56 97.57 97.06 96.76 100.00 沼泽 59.80 90.00 100.00 97.50 100.00 100.00 95.00 100.00 100.00 禾本科 57.71 82.27 88.45 94.82 100.00 99.51 98.28 99.52 100.00 米草沼泽 92.26 90.91 98.72 73.54 99.20 98.79 100.00 98.62 100.00 香蒲沼泽 73.82 84.70 76.27 68.59 100.00 99.74 99.74 100.00 100.00 盐沼 89.90 95.94 99.19 97.82 94.74 93.18 99.75 100.00 100.00 泥滩 88.40 79.29 65.12 88.73 96.48 97.50 97.49 95.31 97.07 水 98.16 97.89 89.05 97.94 100.00 100.00 99.00 100.00 100.00 AA 74.53 79.11 86.27 82.14 94.00 97.60 97.56 97.72 99.77 OA 79.97 82.81 87.15 85.39 96.28 98.05 98.18 98.45 99.71 Kappa 0.7777 0.8089 0.8564 0.8375 0.9585 0.9782 0.9797 0.9828 0.9968 表 3 分类准确率(%)与Kappa系数的对比(Botswana数据集)
SVM[3] 1-D CNN[18] 2-D CNN[18] GCN[12] SSGCN[13] T-S CNN[7] SSGAN[16] SAGCN-FSF SAGCN 水 89.84 100.00 100.00 92.65 100.00 99.18 99.59 100.00 100.00 河马草 87.89 75.00 73.26 94.74 100.00 96.05 98.68 100.00 100.00 漫滩草1 82.35 93.09 74.15 88.94 100.00 99.56 100.00 100.00 100.00 漫滩草2 86.63 81.43 88.5 88.95 99.47 100.00 98.95 100.00 100.00 芦苇 70.57 68.94 53.54 68.85 97.13 99.59 100.00 100.00 100.00 河岸 59.10 56.82 92.91 63.93 78.69 97.54 94.26 100.00 96.72 火疤 82.44 86.61 95.90 95.30 100.00 99.15 92.74 100.00 100.00 岛屿内部 80.28 82.32 86.70 80.90 99.44 100.00 100.00 100.00 100.00 相思林地 69.10 74.43 51.84 63.67 98.96 87.89 98.27 99.31 100.00 相思灌木丛 69.33 65.84 95.28 72.20 99.55 100.00 95.52 98.21 100.00 相思草原 73.50 79.00 99.31 78.93 93.57 99.64 98.57 88.93 97.5 矮可乐豆 71.99 97.73 93.37 77.56 99.36 100.00 98.72 100.00 100.00 混合可乐豆 72.06 77.19 93.68 65.02 98.77 99.18 99.59 99.59 100.00 暴露的土壤 99.57 98.89 100.00 85.71 98.57 98.57 100.00 84.29 100.00 AA 78.19 81.24 85.60 79.81 97.39 98.31 98.21 97.88 99.59 OA 76.16 80.02 84.79 78.16 96.96 98.14 98.03 98.31 99.48 Kappa 0.7427 0.7835 0.8351 0.7632 0.9671 0.9798 0.9787 0.9828 0.9944 -
[1] BIOUCAS-DIAS J M, PLAZA A, CAMPS-VALLS G, et al. Hyperspectral remote sensing data analysis and future challenges[J]. IEEE Geoscience and Remote Sensing Magazine, 2013, 1(2): 6–36. doi: 10.1109/MGRS.2013.2244672 [2] LANDGREBE D. Hyperspectral image data analysis[J]. IEEE Signal Processing Magazine, 2002, 19(1): 17–28. doi: 10.1109/79.974718 [3] BAZI Y and MELGANI F. Toward an optimal SVM classification system for hyperspectral remote sensing images[J]. IEEE Transactions on Geoscience and Remote Sensing, 2006, 44(11): 3374–3385. doi: 10.1109/TGRS.2006.880628 [4] FANG Leyuan, LI Shutao, KANG Xudong, et al. Spectral-spatial hyperspectral image classification via multiscale adaptive sparse representation[J]. IEEE Transactions on Geoscience and Remote Sensing, 2014, 52(12): 7738–7749. doi: 10.1109/TGRS.2014.2318058 [5] 戴晓爱, 郭守恒, 任淯, 等. 基于堆栈式稀疏自编码器的高光谱影像分类[J]. 电子科技大学学报, 2016, 45(3): 382–386. doi: 10.3969/j.issn.1001-0548.2016.02.012DAI Xiaoai, GUO Shouheng, REN Yu, et al. Hyperspectral remote sensing image classification using the stacked sparse autoencoder[J]. Journal of University of Electronic Science and Technology of China, 2016, 45(3): 382–386. doi: 10.3969/j.issn.1001-0548.2016.02.012 [6] CHEN Yushi, ZHAO Xing, and JIA Xiuping. Spectral-spatial classification of hyperspectral data based on deep belief network[J]. IEEE Journal of Selected Topics in Applied Earth Observations and Remote Sensing, 2015, 8(6): 2381–2392. doi: 10.1109/JSTARS.2015.2388577 [7] LI Xian, DING Mingli, and PIŽURICA A. Deep feature fusion via two-stream convolutional neural network for hyperspectral image classification[J]. IEEE Transactions on Geoscience and Remote Sensing, 2020, 58(4): 2615–2629. doi: 10.1109/TGRS.2019.2952758 [8] CHEN Yushi, LIN Zhouhan, ZHAO Xing, et al. Deep learning-based classification of hyperspectral data[J]. IEEE Journal of Selected Topics in Applied Earth Observations and Remote Sensing, 2014, 7(6): 2094–2107. doi: 10.1109/JSTARS.2014.2329330 [9] 倪鼎, 马洪兵. 基于近邻协同的高光谱图像谱-空联合分类[J]. 自动化学报, 2015, 41(2): 273–284. doi: 10.16383/j.aas.2015.c140043NI Ding and MA Hongbing. Spectral-spatial classification of hyperspectral images based on neighborhood collaboration[J]. ACTA Automatica Sinica, 2015, 41(2): 273–284. doi: 10.16383/j.aas.2015.c140043 [10] LI Wei, WU Guodong, ZHANG Fan, et al. Hyperspectral image classification using deep pixel-pair features[J]. IEEE Transactions on Geoscience and Remote Sensing, 2017, 55(2): 844–853. doi: 10.1109/TGRS.2016.2616355 [11] LI Zhaokui, WANG Tianning, LI Wei, et al. Deep multilayer fusion dense network for hyperspectral image classification[J]. IEEE Journal of Selected Topics in Applied Earth Observations and Remote Sensing, 2020, 13: 1258–1270. doi: 10.1109/JSTARS.2020.2982614 [12] KIPF T N and WELLING M. Semi-supervised classification with graph convolutional networks[C]. The 5th International Conference on Learning Representations, Toulon, France, 2017: 1–14. [13] QIN Anyong, SHANG Zhaowei, TIAN Jinyu, et al. Spectral-spatial graph convolutional networks for semisupervised hyperspectral image classification[J]. IEEE Geoscience and Remote Sensing Letters, 2019, 16(2): 241–245. doi: 10.1109/LGRS.2018.2869563 [14] DING Yun, GUO Yuanyuan, CHONG Yanwen, et al. Global consistent graph convolutional network for hyperspectral image classification[J]. IEEE Transactions on Instrumentation and Measurement, 2021, 70: 5501516. doi: 10.1109/TIM.2021.3056750 [15] WANG Haoyu, CHENG Yuhu, CHEN C L P, et al. Semisupervised classification of hyperspectral image based on graph convolutional broad network[J]. IEEE Journal of Selected Topics in Applied Earth Observations and Remote Sensing, 2021, 14: 2995–3005. doi: 10.1109/JSTARS.2021.3062642 [16] SHA Anshu, WANG Bin, WU Xiaofeng, et al. Semisupervised classification for hyperspectral images using graph attention networks[J]. IEEE Geoscience and Remote Sensing Letters, 2021, 18(1): 157–161. doi: 10.1109/LGRS.2020.2966239 [17] SUN Weiwei, YANG Gang, PENG Jiangtao, et al. A multiscale spectral features graph fusion method for hyperspectral band selection[J]. IEEE Transactions on Geoscience and Remote Sensing, 2021, 60: 5513712. doi: 10.1109/TGRS.2021.3102246 [18] CHEN Yushi, JIANG Hanlu, LI Chunyang, et al. Deep feature extraction and classification of hyperspectral images based on convolutional neural networks[J]. IEEE Transactions on Geoscience and Remote Sensing, 2016, 54(10): 6232–6251. doi: 10.1109/TGRS.2016.2584107 -


 下载:
下载:


 下载:
下载:
