Time Series Method Clustering in User Behavior Based on Symmetric Kullback-Leibler Distance
-
摘要: 网络用户随时间变化的行为分析是近年来用户行为分析的热点,通常为了发现用户行为的特征需要对用户做聚类处理。针对用户时序数据的聚类问题,现有研究方法存在计算性能差,距离度量不准确的缺点,无法处理大规模数据。为了解决上述问题,该文提出基于对称KL距离的用户行为时序聚类方法。首先将时序数据转化为概率模型,从划分聚类的角度出发,在距离度量中引入KL距离,用以衡量不同用户间的时间分布差异。针对实网数据中数据规模大的特点,该方法在聚类的各个环节针对KL距离的特点做了优化,并证明了一种高效率的聚类质心求解办法。实验结果证明,该算法相比采用欧式距离和DTW距离度量的聚类算法能提高4%的准确度,与采用medoids聚类质心的聚类算法相比计算时间少了一个量级。采用该算法对实网环境中获取的用户流量数据处理证明了该算法拥有可行的应用价值。
-
关键词:
- 时序聚类 /
- 用户分析 /
- Kullback-Leibler距离
Abstract: Behavioral analysis of Internet users over time is a hot spot in user behavior analysis in recent years, usually clustering users is a way to find the feature of user behavior. Problems like poor computing performance or inaccurate distance metric exist in present research about clustering user time series data, which is unable to deal with large scale data. To solve this problem, a method for clustering time series in user behavior is proposed based on symmetric Kullback-Leibler (KL) distance. First time series data is transformed into probability models, and then a distance metric named KL distance is introduce, using partition clustering method, the different time distribution between different users. For the Large-scale feature of physical network data, each process of clustering is optimized based on the characteristics of KL distance. It also proves an efficient solution for finding the clustering centroids. The experimental results show that this method can improve the accuracy of 4% compared with clustering algorithm using the Euclidean distance metric or DTW metric, and the calculation time of this method is less a quantity degree than clustering algorithm using medoids centroids. This method is used to deal with user traffic data obtained in physical network which proves its application value.-
Key words:
- Time series clustering /
- User analysis /
- Kullback-Leibler distance
-
表 1 基于KL距离的用户行为时序聚类算法
输入:数据集data,类数目k,停止迭代参数threshold 输出:聚类结果cluster cluster old_cluster //初始化cluster, old_cluster data_log = pre_computed(data) //预计算data的对数运算 k_centers = centers_init(data, k) //选择初始质心 for i in iteration: clear cluster; centers_log = pre_computed(k_centers) //预计算质心的对数运算 for u in data: 分配u到距离最近的cluster k_centers:= computed(cluster, data) //重新计算质心 if i > 3 && overlap(cluster, old_cluster)>threshold: //子类重合度大于threshold时停止迭代 break; else: old_cluster <- cluster 表 2 变形描述
变形形式 参数 随机噪声 高斯噪声,零均值,标准差 $\sigma $=0.10, 0.12, 0.15 平移 横轴平移, $\beta $=0.10, 0.30, 0.50 幅值缩放 $\lambda $=0.50, 1.50, 2.00 自变量按比例缩放 时间轴缩放, $\alpha $=1.05, 1.08, 1.10 线性误差 斜率 $\phi $=0.20, 0.50, 1.00 偏置系数 视情况而定,可以取为序列数据中最小值的绝对值,也可以取为常数,本文取 $\gamma $=3.00 表 3 各算法聚类准确率和计算时间
聚类算法和度量方法 Kmeans+欧氏距离 Kmeans+DTW PAM+KL 本文算法 FMI 0.863 0.856 0.852 0.892 时间(s) 0.099 187.589 0.336 0.046 表 4 2017年7月20号至2017年7月21号之间的流记录统计数据
统计指标 数值 流记录规模(104条) 270 去重源IP数目 203356 去重目的IP数目 113728 单条最长的流记录时间(ms) 50315672 单条最短的流记录时间(ms) <1 平均流记录时间(ms) 11586.79 单条流记录最高流量总字节(GByte) 2.126 单条流记录最低流量总字节(Byte) 60 流记录平均流量总字节(Byte) 55945.96 单条流记录最高流量速率(MByte/s) 69.5 单条流记录最低流量速率(Byte/s) <1 单条流记录平均流量速率(Byte/s) 50866.89 表 5 原始流记录转换为概率模型算法
输入:流记录集D,时间粒度参数L,用户数量M 输出:用户流量概率模型 users 初始化数组 users[M][T], users_tmp[M][T] for r in D: userid:=r对应的用户id beginTime:=r开始的时间 endTime:=r结束的时间 speed:=r的平均传输速率 users[userid][beginTime] += speed users_tmp[userid][endTime] += speed for i=0, i<M; i++: for j=1; j<L; j++: users[i][j]=users[i][j –1]-users_tmp[ i][j –1]+users[ i][j] if users[i][j]==0: //KL距离是对数计算,需要对序列进行平滑 users[i][j]=1 表 6 聚类结果分析
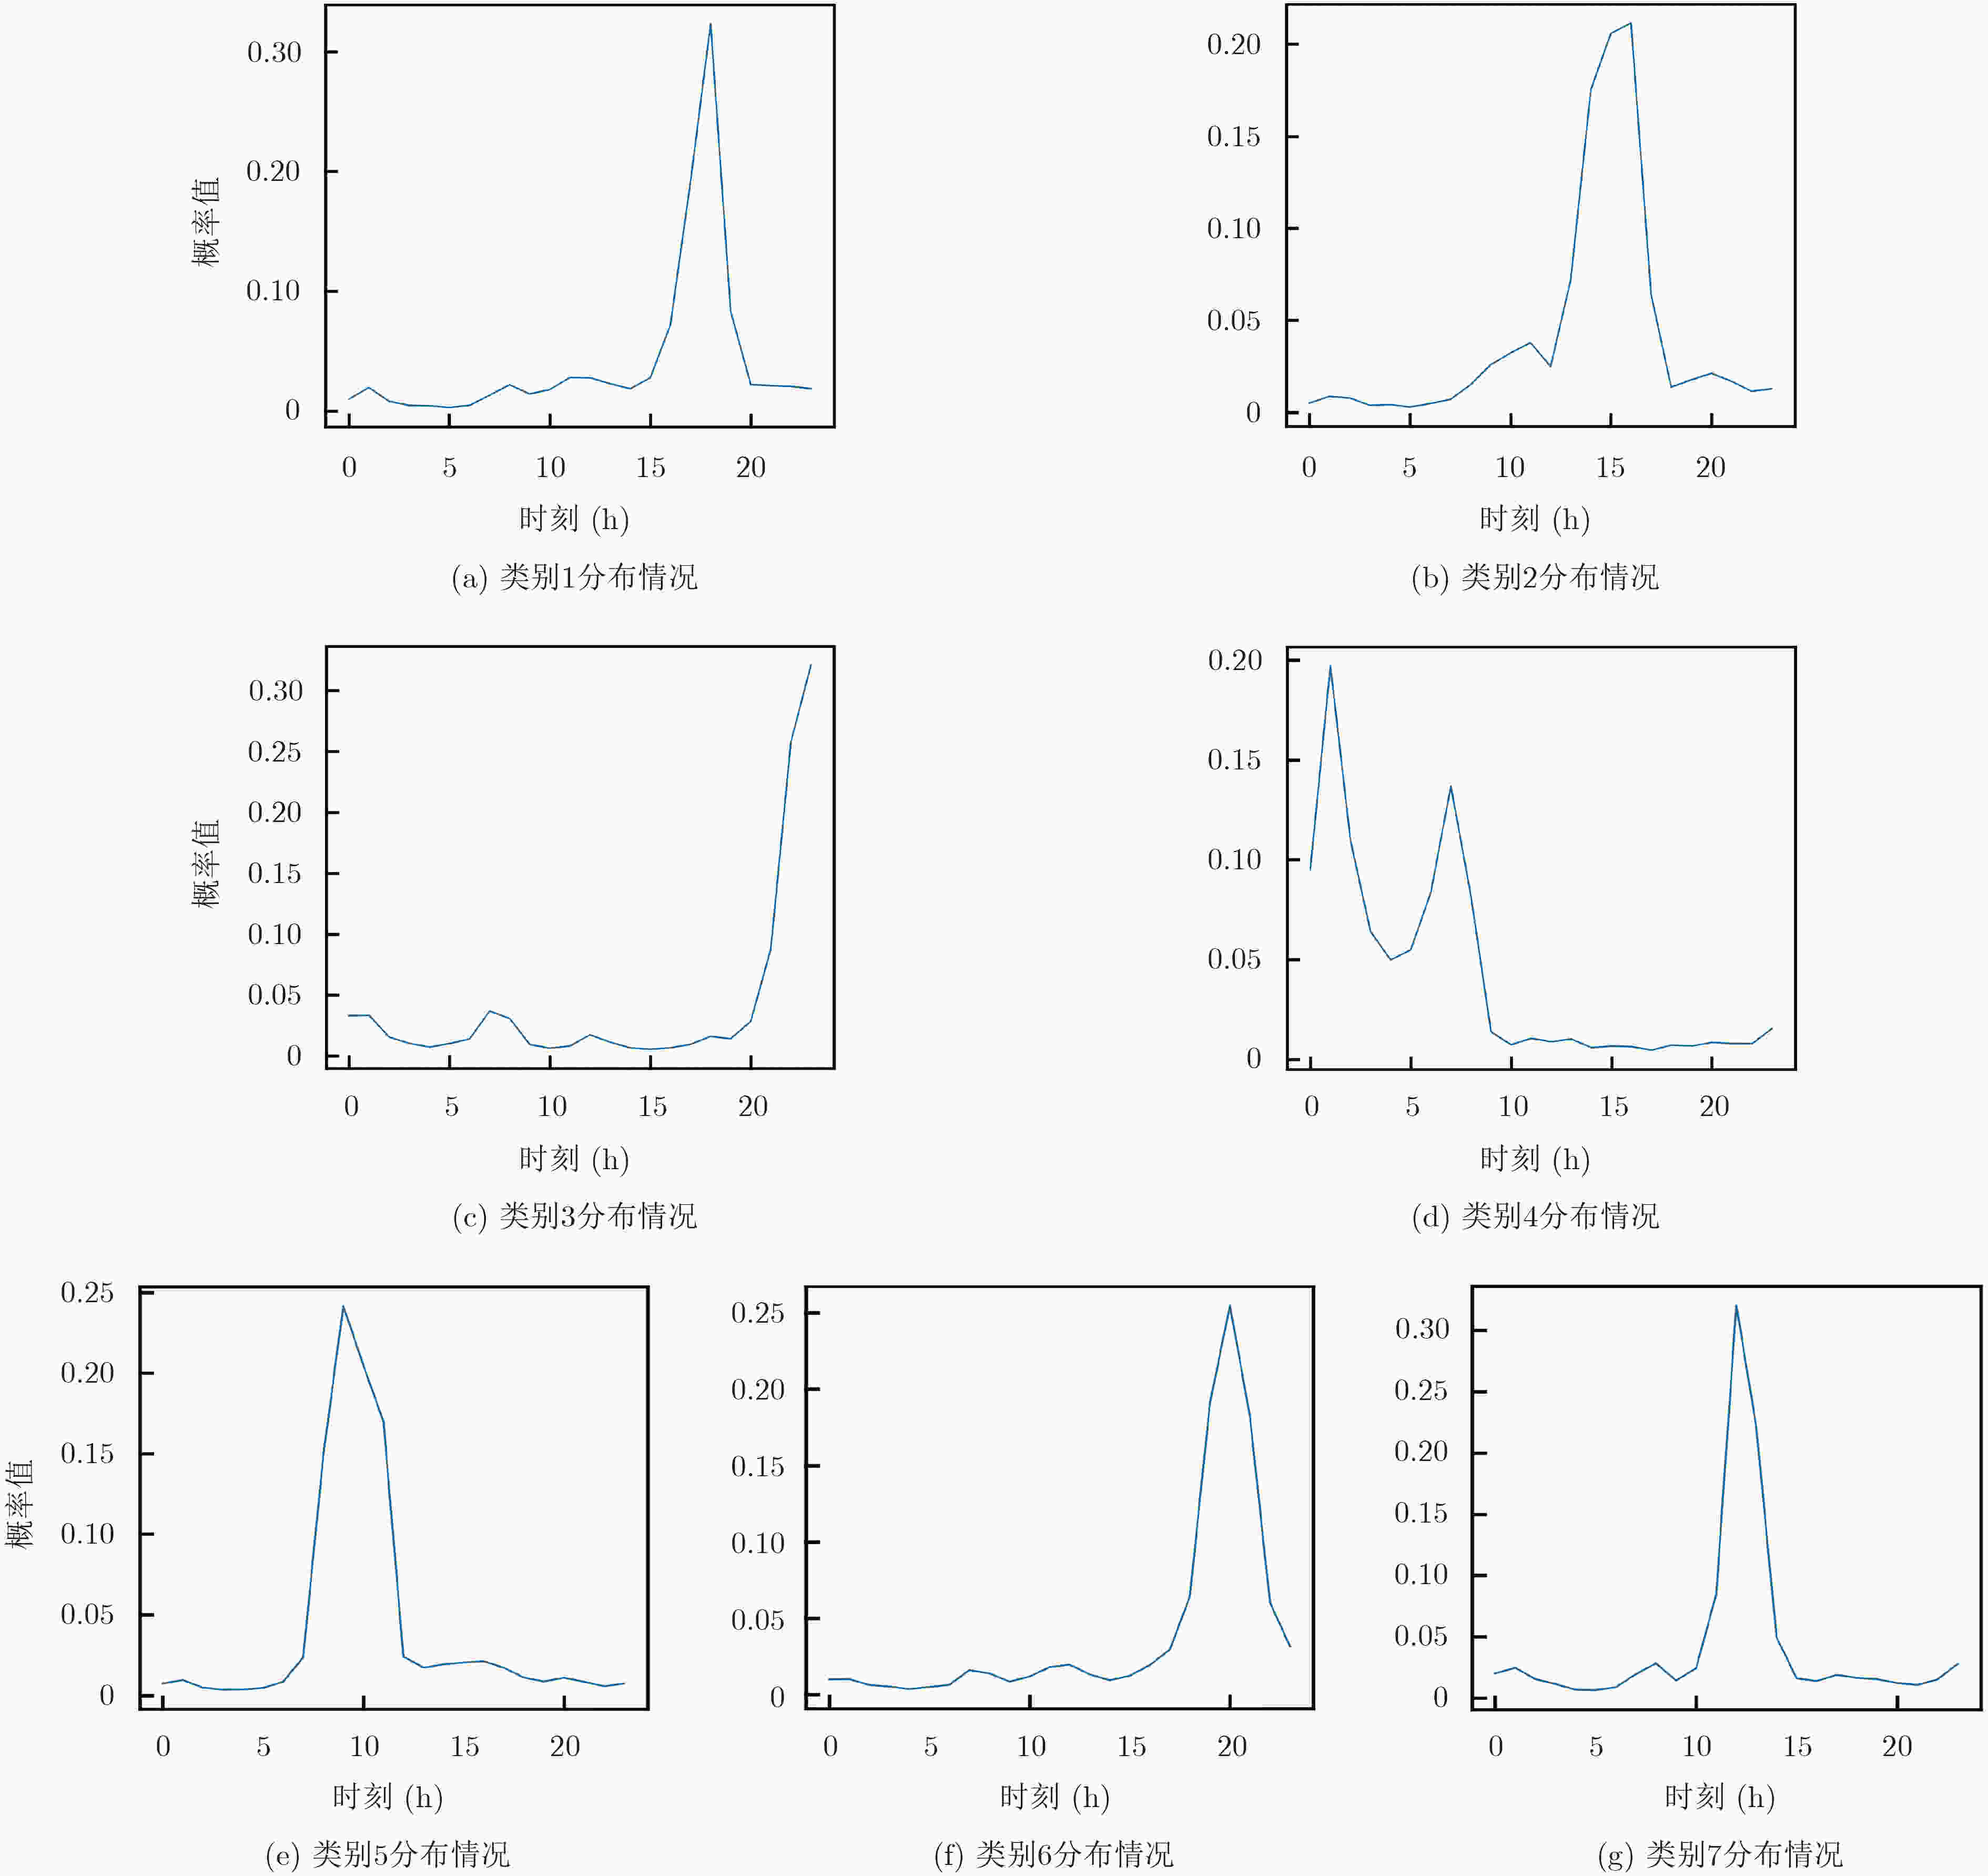
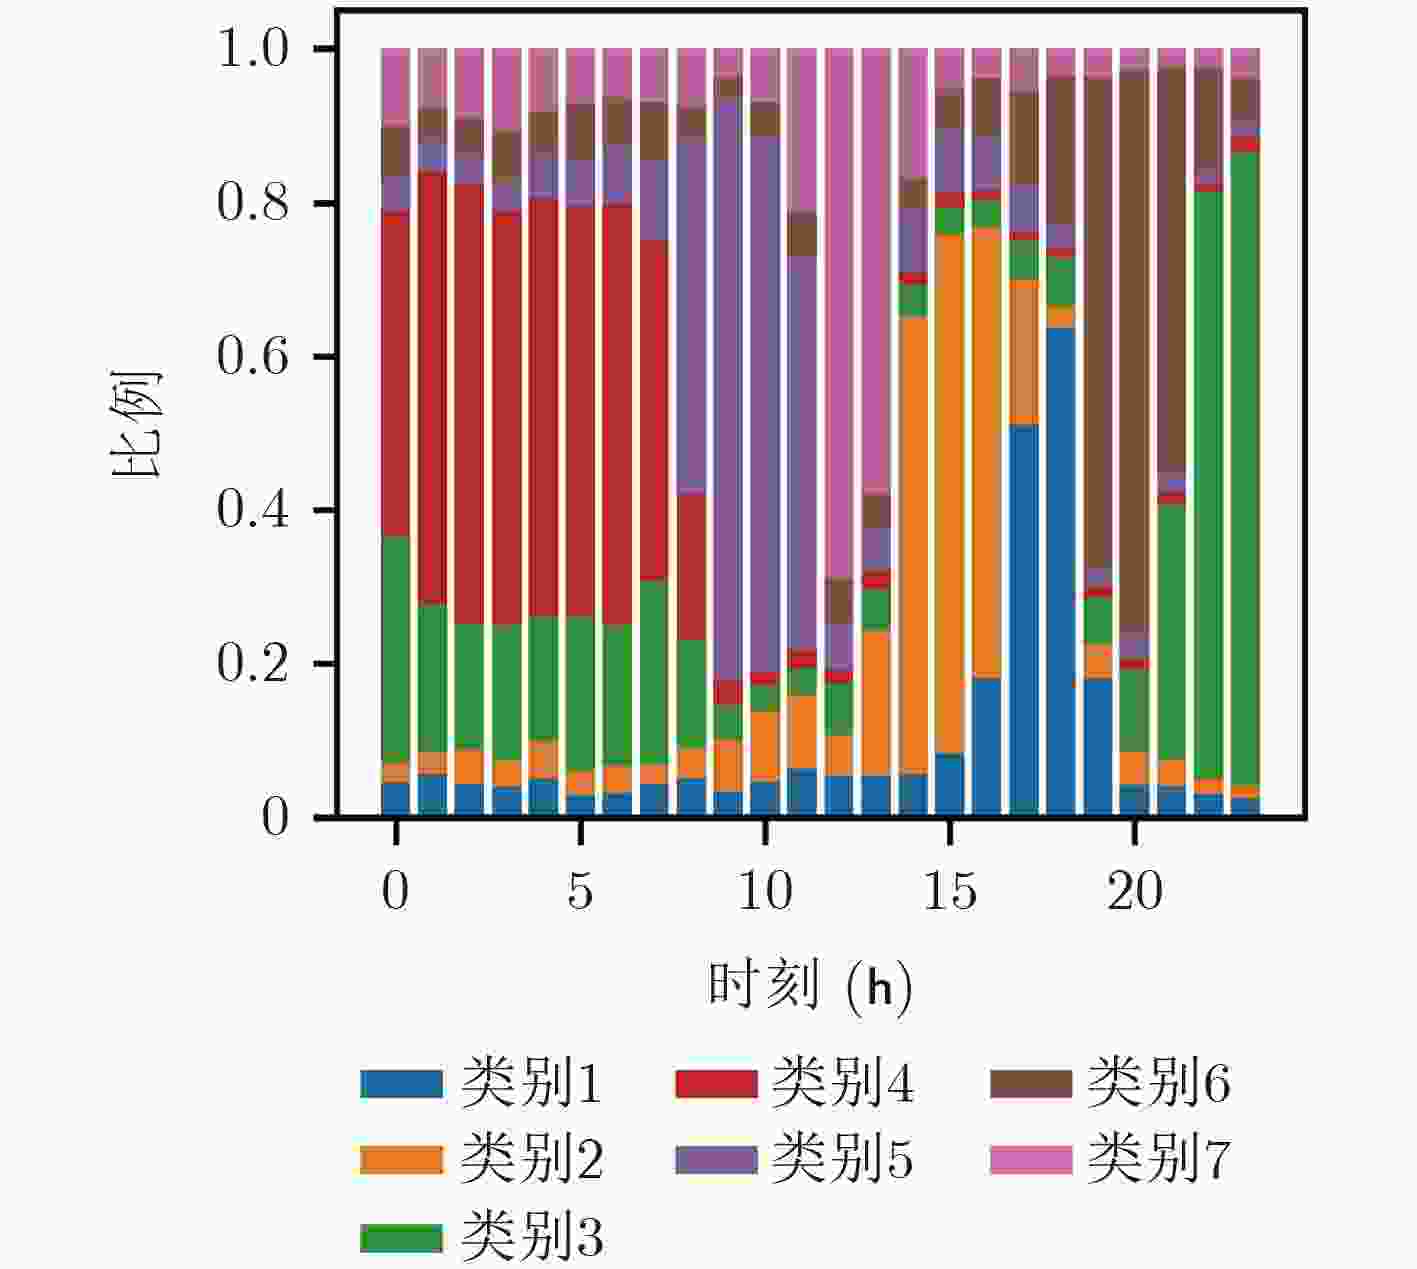
类别 人数(人) 分析 1 2464 主要集中在下午时段使用,占比达到30%,
并且持续时间从下午到晚上。2 2713 这部分用户在15点附近使用幅度最高,总体
对网络依赖性较高。3 4862 所有类别中人数最多的类,主要使用时段是
20点之后,并且逐渐升高,使用时段集中。4 2444 主要在深夜和早上使用网络,其他时段使用
较为平均。5 3250 主要集中在早上使用,使用时间跨度较大。 6 3778 从晚上开始逐渐升高使用量,在20点左右达
到最高,这一类人可能是在下班后使用网络。7 2725 跨度较小,主要集中在中午时段使用。 -
延皓. 基于流量监测的网络用户行为分析[D]. [博士论文], 北京邮电大学, 2011.YAN H. Network user behavior analysis base on traffic monitoring and measurement[D]. [Ph.D. dissertation], Beijing University of Post and Telecommunications, 2011. NAJAFABADI M M, KHOSHGOFTAAR T M, CALVERT C, et al. User behavior anomaly detection for application layer DDoS attacks[C]. 2017 IEEE International Conference on Information Reuse and Integration (IRI), San Diego, USA, 2017: 154–161. 方志祥, 于冲, 张韬, 等. 手机用户上网时段的混合Markov预测方法[J]. 地球信息科学学报, 2017, 19(8): 1019–1025 doi: 10.3724/SP.J.1047.2017.01019FANG Zhixiang, YU Chong, ZHANG Tao, et al. A mixed arkov method to predict the surfing time period of mobile phone users[J]. Journal of Geo-Information Science, 2017, 19(8): 1019–1025 doi: 10.3724/SP.J.1047.2017.01019 毛佳昕, 刘奕群, 张敏, 等. 基于用户行为的微博用户社会影响力分析[J]. 计算机学报, 2014, 37(4): 791–800 doi: 10.3724/SP.J.1016.2014.00791MAO Jiaxin, LIU Yiqun, ZHANG Min, et al. Social influence anal sis for micro-blog user based on user behavior[J]. Chinese Journal of Computers, 2014, 37(4): 791–800 doi: 10.3724/SP.J.1016.2014.00791 ZHU Jiang, WANG Baixuan, and WU Bin. Social network users clustering based on multivariate time series of emotional behavior[J]. Journal of China Universities of Posts and Telecommunications, 2014, 21(2): 21–31 doi: 10.1016/S1005-8885(14)60282-X YAN Hao, DOU Yinan, LIU Fang, et al. Time division based on analyses of network user time span preference[C]. 2009 IEEE International Conference on Network Infrastructure and Digital Content, Beijing, China, 2009: 177–181. SALGADO C M, FERREIRA M C, and VIEIRA S M. Mixed fuzzy clustering for misaligned time series[J]. IEEE Transactions on Fuzzy Systems, 2017, 25(6): 1777–1794 doi: 10.1109/TFUZZ.2016.2633375 TEERARATKUL T, NEILL D O, and LALL S. Shape-based approach to household electric load curve clustering and prediction[J]. IEEE Transactions on Smart Grid, 2017 doi: 10.1109/TSG.2017.2683461 GHASSEMPOUR S, GIROSI F, and MAEDER A. Clustering multivariate time series using hidden markov models[J]. International Journal of Environmental Research and Public Health, 2014, 11(3): 2741–2763 doi: 10.3390/ijerph110302741 AGHABOZORGI S, SHIRKHORSHIDI A S, and WAH T Y. Time-series clustering — A decade review[J]. Information Systems, 2015, 53: 16–38 doi: 10.1016/j.is.2015.04.007 RATANAMAHATANA C, KEOGH E, BAGNALL A J, et al. A Novel Bit level time series representation with implication of similarity search and clustering[C]. 9th Pacific-Asia Conference on Advances in Knowledge Discovery and Data Mining, Hanoi, 2005: 771–777. KEOGH E J and PAZZANI M J. A simple dimensionality reduction technique for fast similarity search in large time series databases[C]. 4th Pacific-Asia Conference on Knowledge Discovery and Data Mining, Kyoto, Japan, 2000: 122–133. KULLBACK S and LEIBLER R A. On information and sufficiency[J]. The Annals of Mathematical Statistics, 1951, 22(1): 79–86 doi: 10.1214/aoms/1177729694 FOWLKES E B and MALLOWS C L. A method for comparing two hierarchical clusterings[J]. Journal of the American Statistical Association, 1983, 78(383): 553–569 doi: 10.1080/01621459.1983.10478008 ROUSSEEUW P J. Silhouettes: A graphical aid to the interpretation and validation of cluster analysis[J]. Journal of Computational and Applied Mathematics, 1986, 20(1): 53–65 doi: 10.1016/0377-0427(87)90125 -



 下载:
下载:


 下载:
下载:
