Elevation Error Prediction Dataset Using Global Open-source Digital Elevation Model
-
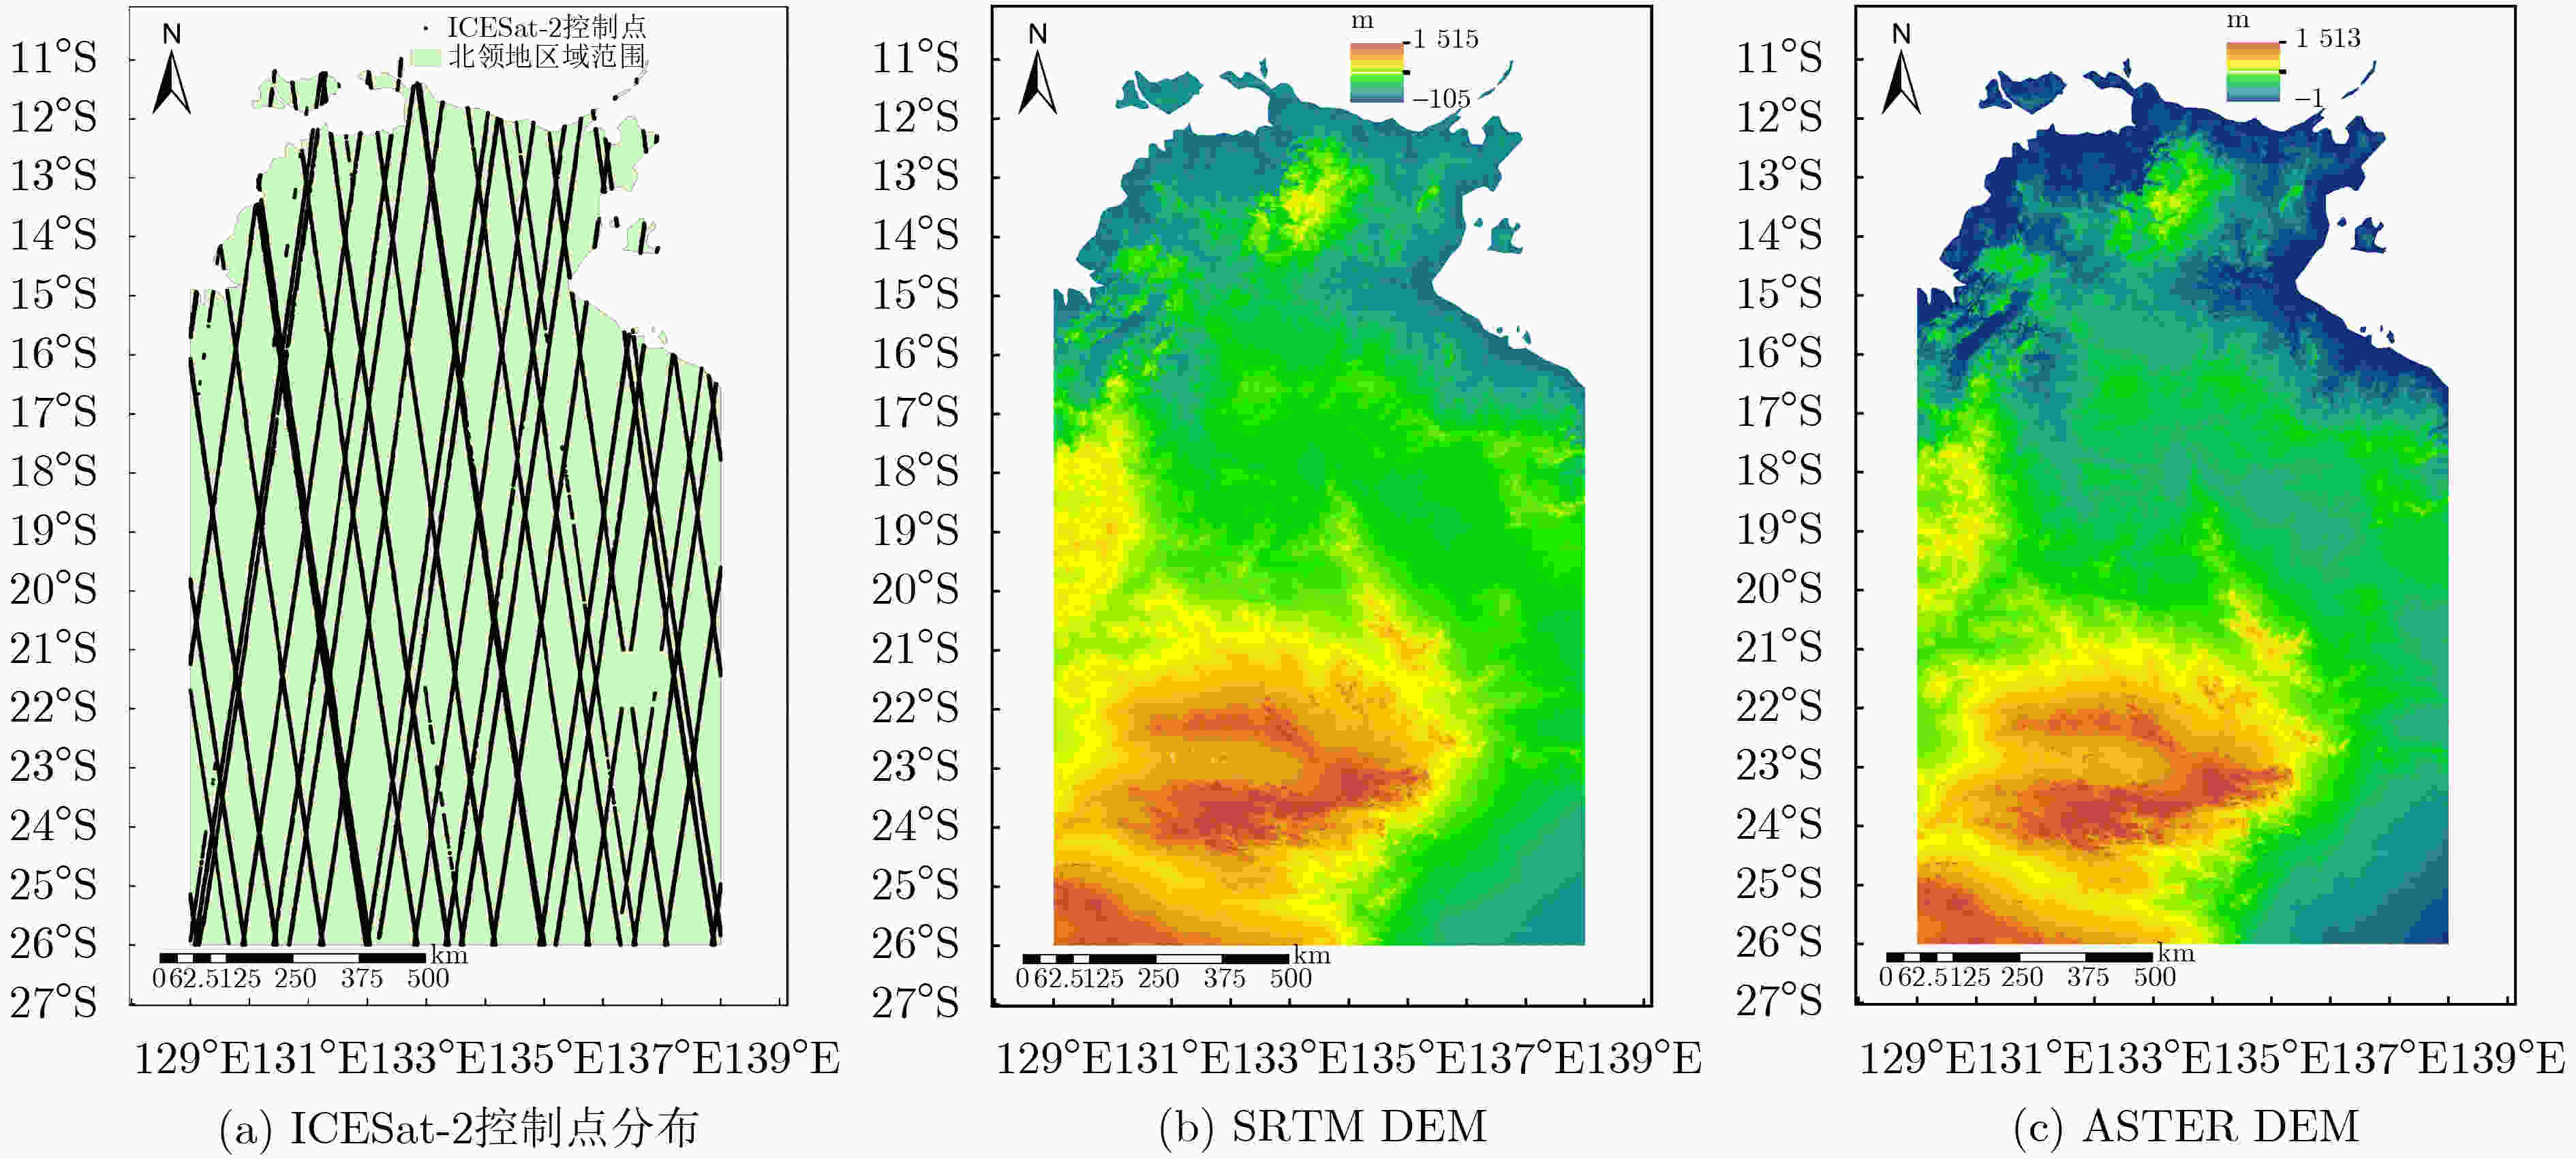
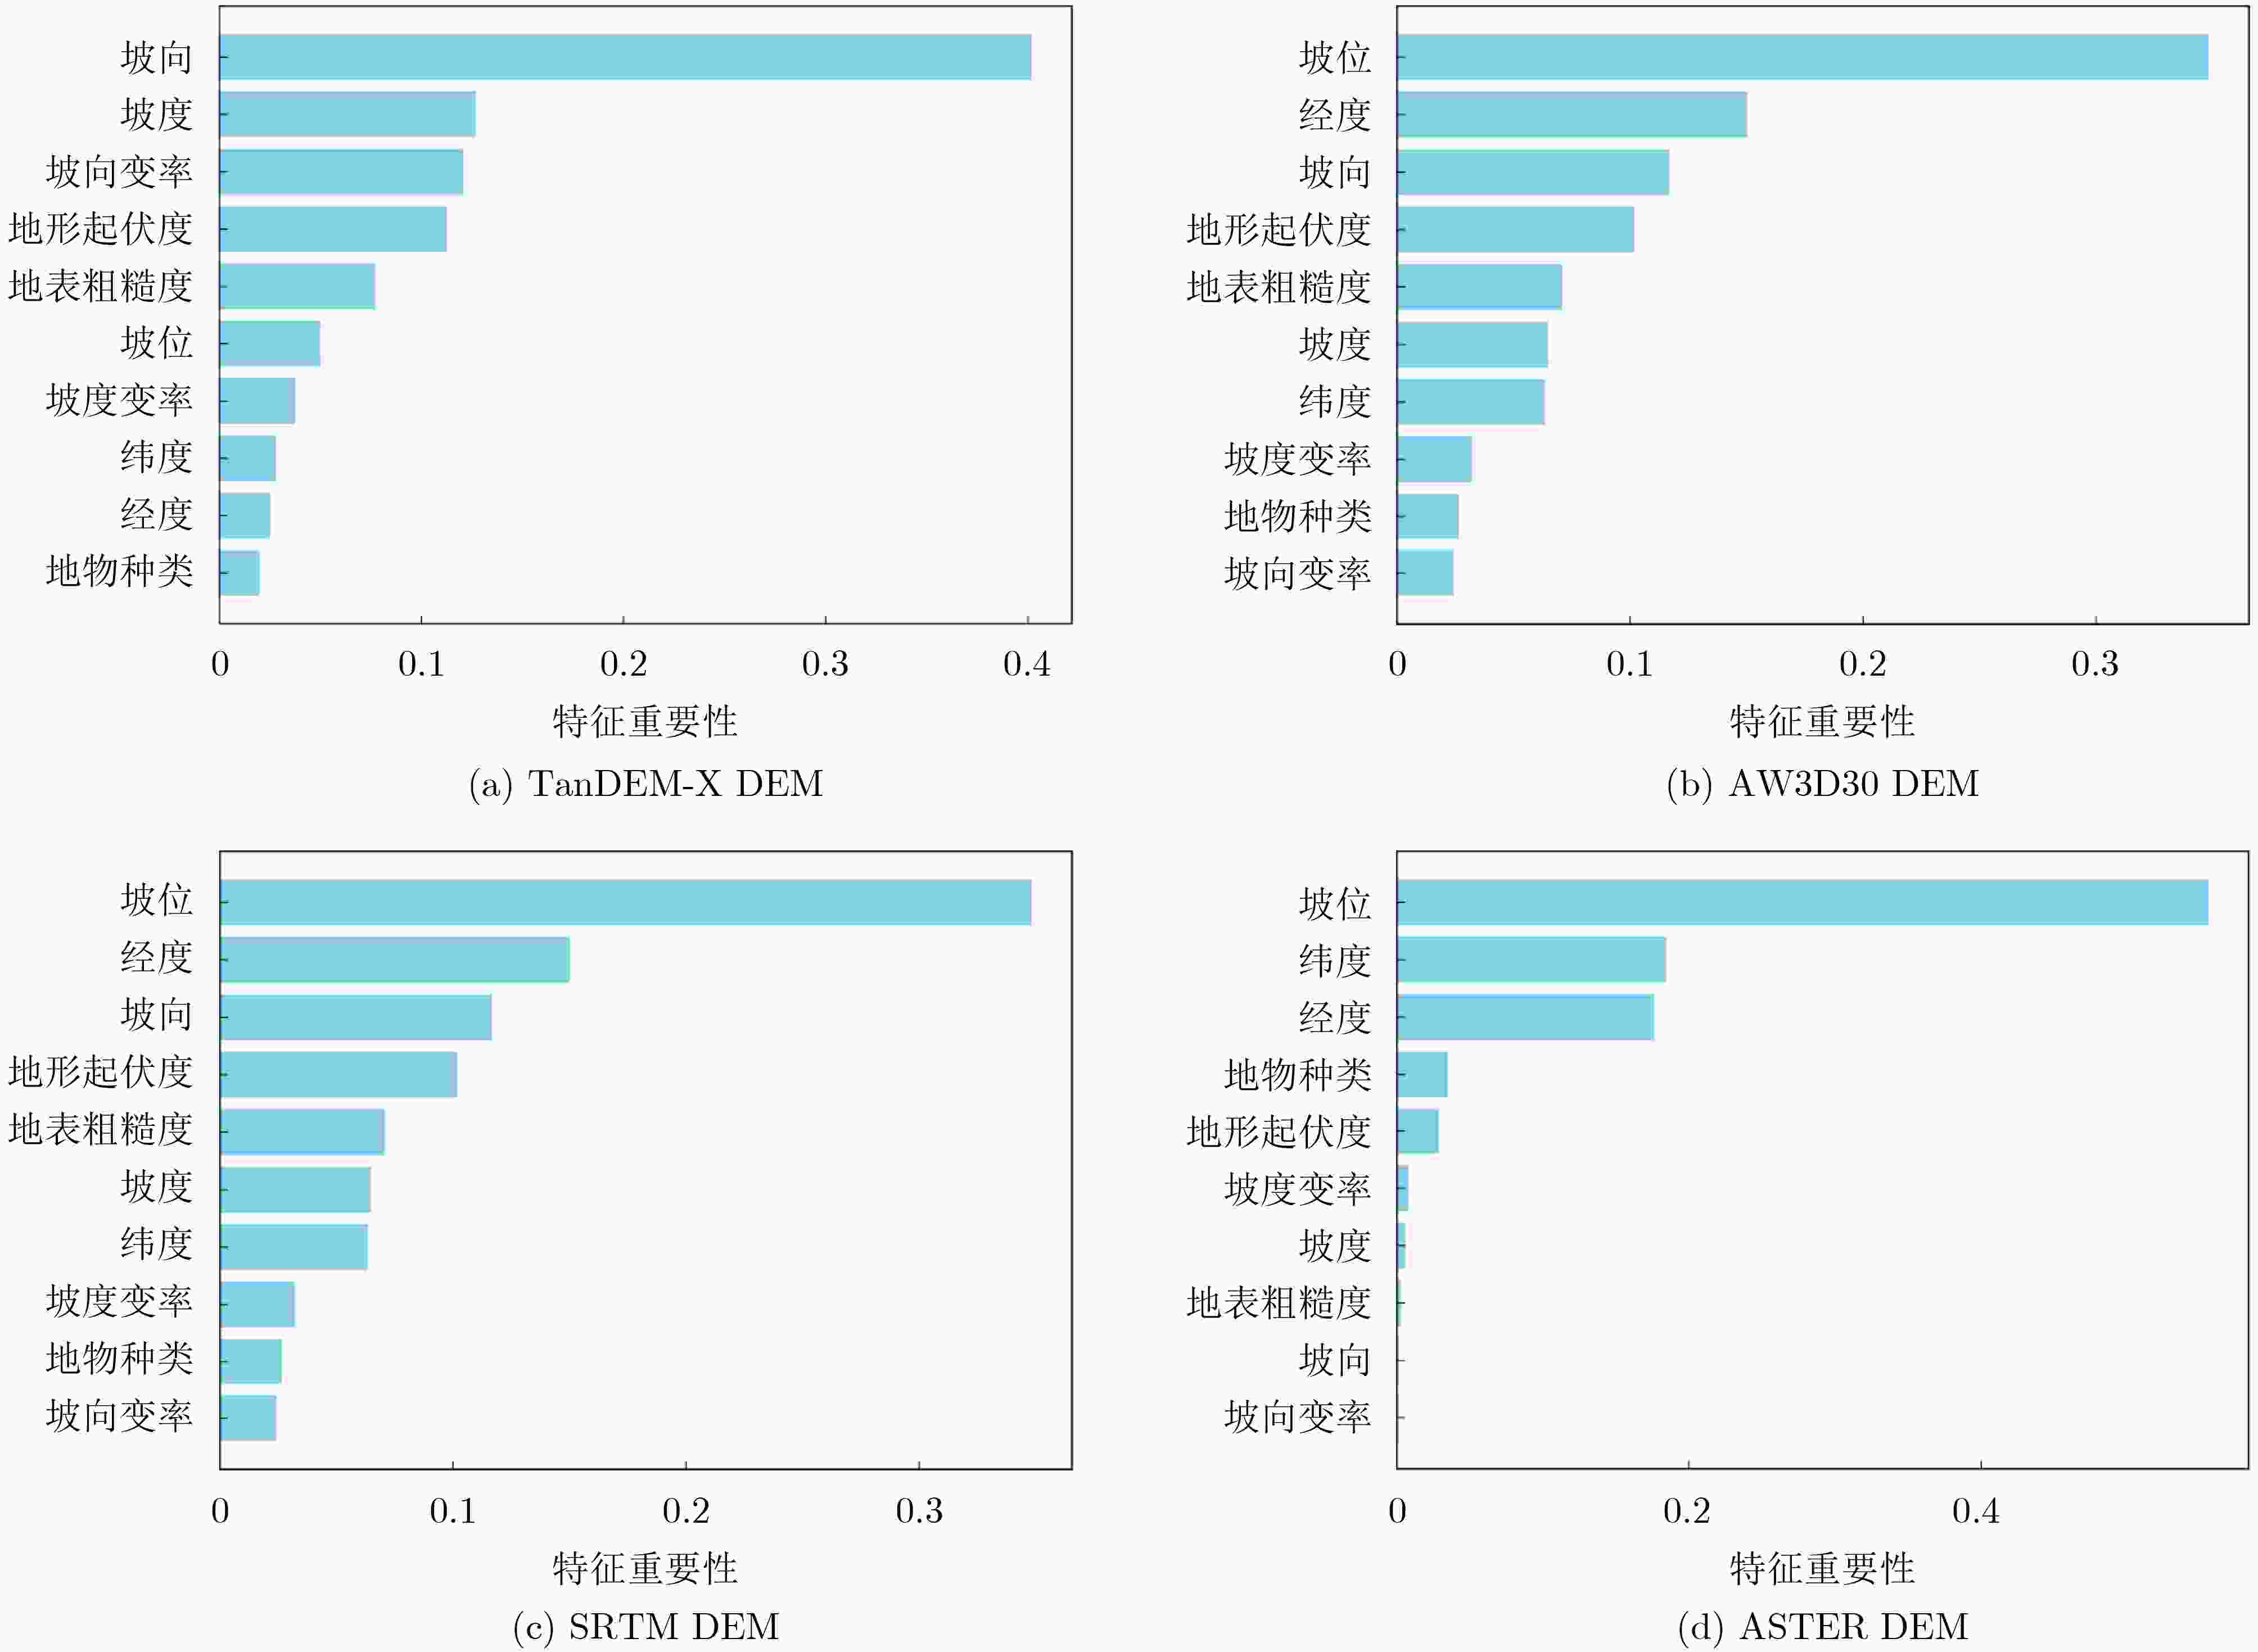
摘要: 数字高程模型(DEM)校正一直是遥感地学研究中的重要内容,近年来蓬勃发展的机器学习新方法为DEM高程误差校正提供了新的解决途径。由于机器学习等人工智能方法依赖大量的训练数据,考虑到目前缺少大区域公开的、统一的、大规模和规范化多源 DEM 高程误差预测数据集,针对数据集缺失的问题,该文公开了多源DEM高程误差预测数据集(DEEP-Dataset)。该数据集包括4个子数据集,分别基于中国广东省研究区域的 数字高程测量的 TerraSAR-X 附加组件(TanDEM-X) DEM和先进陆地观测卫星世界3D-30米(AW3D30) DEM以及澳大利亚北领地研究区域的航天飞机雷达地形测绘任务(SRTM) DEM和先进星载热发射和反射辐射计全球数字高程模型 (ASTER) DEM构成。其中,广东省研究区域的样本数量约为40 000,北领地研究区域的样本数约量为1 600 000。数据集中的每个样本均由10个特征组成,涵盖了地理空间、地物种类以及地表形态等特征信息。通过设置机器学习模型测试、DEM校正以及特征重要性评估等对比实验,验证了DEEP-Dataset在实际模型训练和DEM校正中的有效性,也证明了该数据集的合理性和丰富性。Abstract: The correction in Digital Elevation Models (DEMs) has always been a crucial aspect of remote sensing geoscience research. The burgeoning development of new machine learning methods in recent years has provided novel solutions for the correction of DEM elevation errors. Given the reliance of machine learning and other artificial intelligence methods on extensive training data, and considering the current lack of publicly available, unified, large-scale, and standardized multisource DEM elevation error prediction datasets for large areas, the multi-source DEM Elevation Error Prediction Dataset (DEEP-Dataset) is introduced in this paper. This dataset comprises four sub-datasets, based on the TerraSAR-X add-on for Digital Elevation Measurements (TanDEM-X) DEM and Advanced land observing satellite World 3D-30 m (AW3D30) DEM in the Guangdong Province study area of China, and the Shuttle Radar Topography Mission (SRTM) DEM and Advanced Spaceborne Thermal Emission and reflection Radiometer (ASTER) DEM in the Northern Territory study area of Australia. The Guangdong Province sample comprises approximately 40 000 instances, while the Northern Territory sample includes about 1 600 000 instances. Each sample in the dataset consists of ten features, encompassing geographic spatial information, land cover types, and topographic attributes. The effectiveness of the DEEP-Dataset in actual model training and DEM correction has been validated through a series of comparative experiments, including machine learning model testing, DEM correction, and feature importance assessment. These experiments demonstrate the dataset’s rationality, effectiveness, and comprehensiveness.
-
表 1 DEM和ICESat-2产品基本属性介绍
DEM 传感器类型 空间分辨率(m) 坐标系 覆盖范围 SRTM 雷达 30 WGS84 56°S~60°N ASTER 光学 30 WGS84 $ 83^\circ {\text{S}}{\text{~}}83^\circ {\text{N}} $ TanDEM-X 雷达 30 WGS84 $ 90^\circ {\text{S}}{\text{~}}90^\circ {\text{N}} $ AW3D30 光学 30 WGS84 $ 84^\circ {\text{S}}{\text{~}}84^\circ {\text{N}} $ ICESat-2 激光 – WGS84 $ 88^\circ {\text{S}}{\text{~}}88^\circ {\text{N}} $ 表 2 DEEP-Dataset介绍
研究区域 面积(km2) 地形特点 DEM 样本数量 特征属性 目标变量 中国广东省 179 725 高山、丘陵、台地和平原 TanDEM-X 18 415 经度、纬度、地物种类、坡度、
坡向、坡位、地形起伏度、地表粗糙度、
坡度变率、坡向变率高程误差 AW3D30 18 439 澳大利亚北领地 1 420 968 平原、高原、山地和沙漠 SRTM 795 391 ASTER 795 495 表 3 ICESat-2 激光控制点粗筛标准
指标 参考值 与原有参考 DEM 对比高差 abs(h_te_best_fit–dem_h)<30 m 表征地表高度统计量之间的差距 max_diff(h_te_best_fit, h_te_interp, h_median)<0.5 地表光子绝对数量和占比 n_te_ photons >50, ratio_te_photos>50% 云量 cloud_flag_atm <10% h_uncertainty 离群值筛除 <2×RMSE (h_uncertainty) 表 4 特征属性介绍
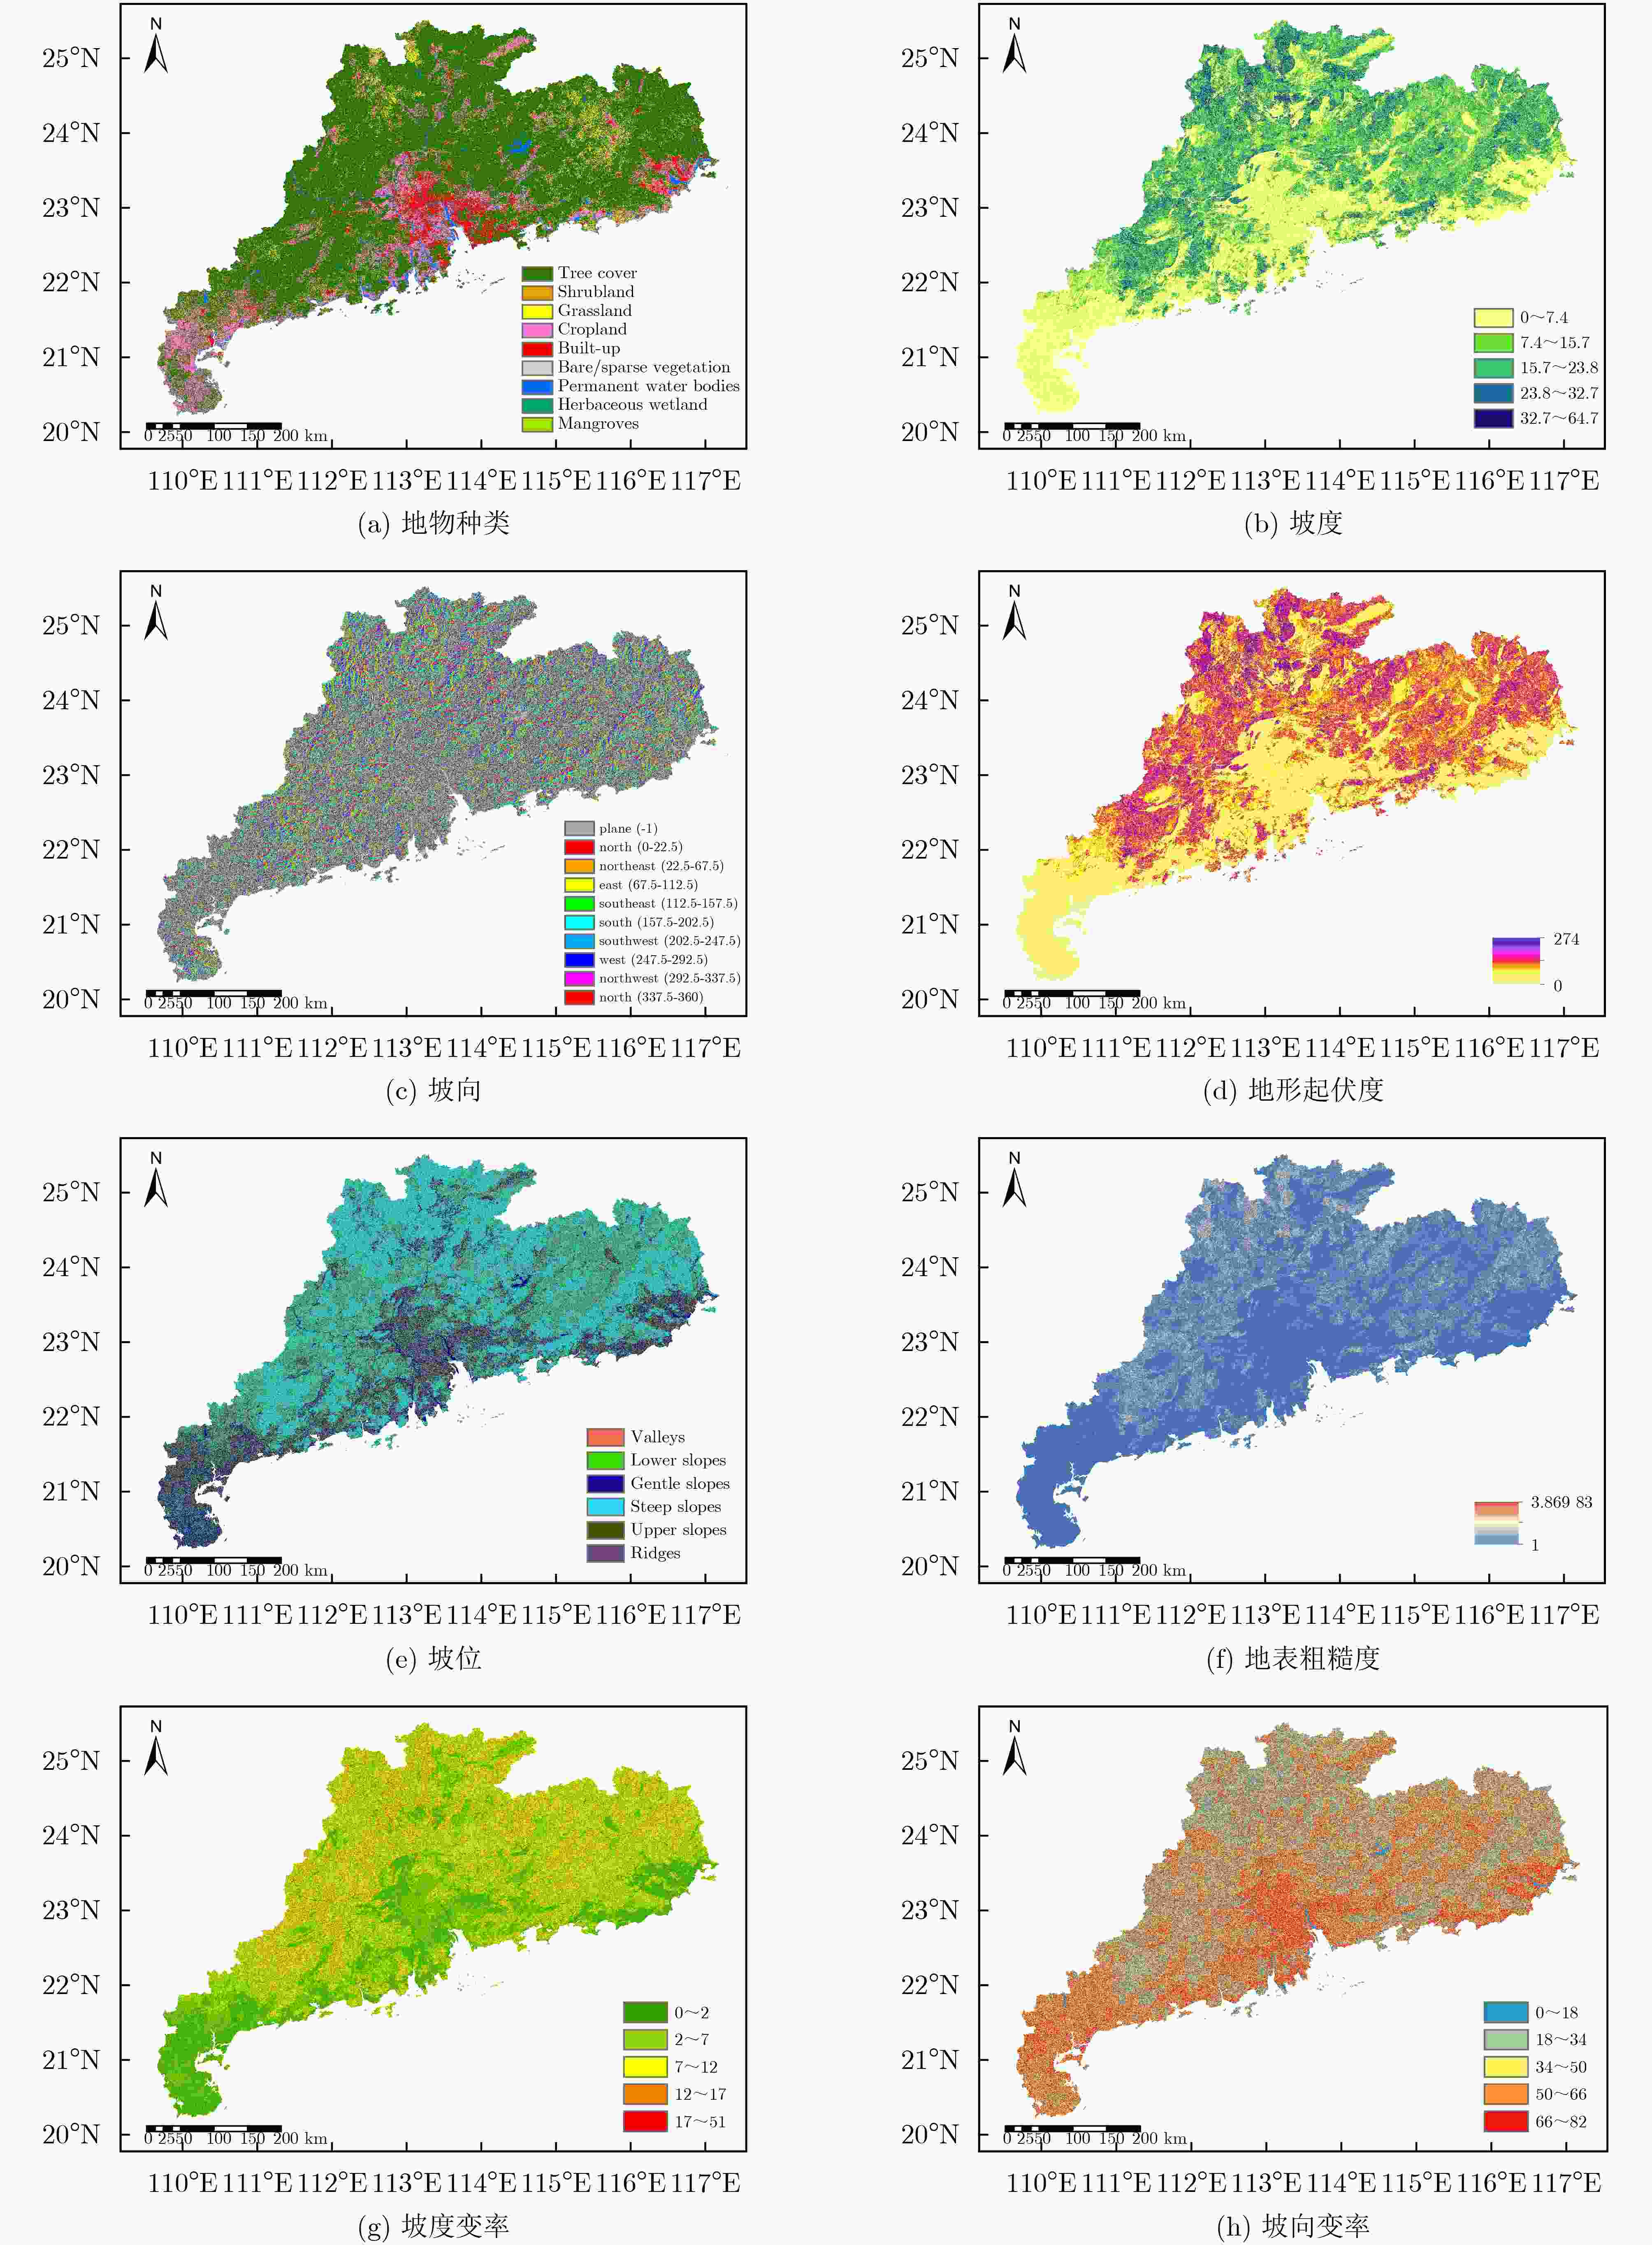
特征属性 公式 含义说明 符号 经度 / 经度是从本初子午线向东或向西测量的角度。 X 纬度 / 纬度是从赤道向北或向南测量的角度。 Y 地物种类 / 表示DEM单元格内覆盖的地表类型,如森林、城市、水体等9种。 $ \omega $ 坡度 $ \arctan \left( {\sqrt {{{\left( {\dfrac{{\partial Z}}{{\partial X}}} \right)}^2} + {{\left( {\dfrac{{\partial Z}}{{\partial Y}}} \right)}^2}} } \right) $ 坡度是指坡面的倾斜与陡峭程度,即高程变化值与距离的比值。Z是高程值,X和Y分别是东西方向和南北方向的空间坐标。$ (\partial Z/\partial X) $和$ (\partial Z/\partial Y) $表示沿格网的高程变化率。 $ \theta $ 坡向 $ {\text{atan}} 2\left( {\dfrac{{\partial Z}}{{\partial Y}},\dfrac{{\partial Z}}{{\partial X}}} \right) $ 坡向是指地面某一点的最大降水方向,即水流从该点流向的方向。atan2是两参数的反正切函数,处理了四个象限的坡向计算。 $ \kappa $ 坡位 / 坡位是指某一点相对于周围点的高度位置,通过分析邻近的坡度和高程值来确的,没有固定的公式,需要确定局部最大值和最小值以识别山脊、山谷和山坡。 $ \psi $ 地形起伏度 $ {Z_{{\text{ref}}}}(i, j){\text{ }} = {Z_{{\text{max}}}} - {Z_{{\text{min}}}} $ 地形起伏度是指在一个特定的区域内,最高点海拔高度Zmax与最低点海拔高度Zmin的差值。 $ \alpha $ 地表粗糙度 $ \sqrt{\dfrac{1}{n}\displaystyle\sum _{i=1}^{n}{\left({Z}_{i}-\overline{Z}\right)}^{2}} $ 地表粗糙度是指地表表面的不规则程度,即地表表面起伏程度的大小。$ {Z_i} $是邻近像素的高程值,$ \bar Z $是这些高程值的平均,n是像素数量。 $ \beta $ 坡度变率 $ \sqrt{\dfrac{1}{n}\displaystyle\sum _{i=1}^{n}{\left({\theta }_{i}-\overline{\theta }\right)}^{2}} $ 坡度变率是指地面坡度在微分空间的变化率。$ {\theta _i} $是周围像素的坡度值,$ \bar \theta $是平均坡度值,n是周围像素的数量。 $ \varphi $ 坡向变率 $ \sqrt {{\text{Var}}(\cos (\kappa )) + {\text{Var}}(\sin (\kappa ))} $ 坡向变率是提取坡向基础上提取坡向的变化率。$ \kappa $是坡向角度值,Var是方差。 $ \lambda $ 表 5 中国广东省研究区域模型测试和DEM校正实验结果
单位 DEM校正前(m) 方法 模型测试 DEM校正后(m) 提升精度(%) TanDEM-X AW3D30 TanDEM-X AW3D30 TanDEM-X AW3D30 TanDEM-X AW3D30 MAE 4.734 3.094 RF 3.931 2.513 3.524 2.876 25.56 7.05 ET 3.879 2.522 3.025 2.471 36.10 20.14 ANN 4.157 2.821 4.614 2.672 2.53 13.64 BA 3.935 2.515 3.507 1.838 25.92 40.59 SD 8.388 4.711 RF 6.881 4.223 7.825 4.542 6.71 3.59 ET 6.835 4.212 7.900 4.578 5.82 2.82 ANN 7.282 4.775 8.376 4.760 0.14 –1.04 BA 6.882 4.213 7.804 3.952 6.96 16.11 RMSE 8.388 4.712 RF 6.881 4.225 7.826 4.543 6.70 3.59 ET 6.836 4.214 7.901 4.590 5.81 2.59 ANN 7.287 4.782 8.381 4.761 0.08 –1.04 BA 6.883 4.213 7.810 3.963 6.89 15.90 表 6 澳大利亚北领地研究区域模型测试和DEM校正实验结果
单位 DEM校正前(m) 方法 模型测试 DEM校正后(m) 提升精度(%) SRTM ASTER SRTM ASTER SRTM ASTER SRTM ASTER MAE 2.341 6.507 RF 0.892 1.998 2.036 3.282 13.03 49.56 ET 0.893 1.997 0.395 0.840 83.13 87.09 ANN 1.060 2.646 1.127 3.659 51.86 43.77 BA 0.883 1.917 0.559 1.319 76.12 79.73 SD 2.955 7.756 RF 1.314 2.800 2.586 4.289 12.49 44.70 ET 1.315 2.813 0.972 2.361 67.11 69.56 ANN 1.493 3.573 2.436 4.798 17.56 38.14 BA 1.311 2.706 1.019 2.268 65.52 70.76 RMSE 2.960 7.762 RF 1.315 2.801 2.586 4.289 12.64 44.74 ET 1.317 2.816 0.973 2.362 67.13 69.57 ANN 1.494 3.573 2.437 4.807 17.67 38.07 BA 1.312 2.708 1.020 2.269 65.54 70.77 -
[1] OKOLIE C J and SMIT J L. A systematic review and meta-analysis of Digital elevation model (DEM) fusion: Pre-processing, methods and applications[J]. ISPRS Journal of Photogrammetry and Remote Sensing, 2022, 188: 1–29. doi: 10.1016/j.isprsjprs.2022.03.016. [2] ZHAO Yaqi and YE Hongxia. SqUNet: An high-performance network for crater detection with DEM data[J]. IEEE Journal of Selected Topics in Applied Earth Observations and Remote Sensing, 2023, 16: 8577–8585. doi: 10.1109/JSTARS.2023.3314128. [3] LUEDELING E, SIEBERT S, and BUERKERT A. Filling the voids in the SRTM elevation model — A TIN-based delta surface approach[J]. ISPRS Journal of Photogrammetry and Remote Sensing, 2007, 62(4): 283–294. doi: 10.1016/j.isprsjprs.2007.05.004. [4] FREY H and PAUL F. On the suitability of the SRTM DEM and ASTER GDEM for the compilation of topographic parameters in glacier inventories[J]. International Journal of Applied Earth Observation and Geoinformation, 2012, 18: 480–490. doi: 10.1016/J.JAG.2011.09.020. [5] SCHREYER J, BYRON WALKER B, and LAKES T. Implementing urban canopy height derived from a TanDEM-X-DEM: An expert survey and case study[J]. ISPRS Journal of Photogrammetry and Remote Sensing, 2022, 187: 345–361. doi: 10.1016/J.ISPRSJPRS.2022.02.015. [6] HUANG Huabing, CHEN Peimin, XU Xiaoqing, et al. Estimating building height in China from ALOS AW3D30[J]. ISPRS Journal of Photogrammetry and Remote Sensing, 2022, 185: 146–157. doi: 10.1016/j.isprsjprs.2022.01.022. [7] GONZALEZ J H, BACHMANN M, SCHEIBER R, et al. Definition of ICESat selection criteria for their use as height references for TanDEM-X[J]. IEEE Transactions on Geoscience and Remote Sensing, 2010, 48(6): 2750–2757. doi: 10.1109/TGRS.2010.2041355. [8] 刘燕, 林赟, 谭维贤, 等. 基于圆迹干涉SAR的DEM提取[J]. 电子与信息学报, 2015, 37(6): 1463–1469. doi: 10.11999/JEIT141022.LIU Yan, LIN Yun, TAN Weixian, et al. DEM extraction based on interferometric circular SAR[J]. Journal of Electronics & Information Technology, 2015, 37(6): 1463–1469. doi: 10.11999/JEIT141022. [9] HUESO GONZALEZ J, BACHMANN M, KRIEGER G, et al. Development of the TanDEM-X calibration concept: Analysis of systematic errors[J]. IEEE Transactions on Geoscience and Remote Sensing, 2010, 48(2): 716–726. doi: 10.1109/TGRS.2009.2034980. [10] LI Binbin, XIE Huan, TONG Xiaohua, et al. A global-scale DEM elevation correction model using ICESat-2 laser altimetry data[J]. IEEE Transactions on Geoscience and Remote Sensing, 2023, 61: 1–15. doi: 10.1109/TGRS.2023.3321956. [11] BAGHERI H, SCHMITT M, and ZHU Xiaoxiang. Fusion of TanDEM-X and cartosat-1 elevation data supported by neural network-predicted weight maps[J]. ISPRS Journal of Photogrammetry and Remote Sensing, 2018, 144: 285–297. doi: 10.1016/j.isprsjprs.2018.07.007. [12] TIAN Yu, LEI Shaogang, BIAN Zhengfu, et al. Improving the accuracy of open source digital elevation models with multi-scale fusion and a slope position-based linear regression method[J]. Remote Sensing, 2018, 10(12): 1861. doi: 10.3390/rs10121861. [13] POURSHAMSI M, XIA Junshi, YOKOYA N, et al. Tropical forest canopy height estimation from combined polarimetric SAR and LiDAR using machine-learning[J]. ISPRS Journal of Photogrammetry and Remote Sensing, 2021, 172: 79–94. doi: 10.1016/j.isprsjprs.2020.11.008. [14] MA Xiaojie, JI Kefeng, ZHANG Linbin, et al. SAR target open-set recognition based on joint training of class-specific sub-dictionary learning[J]. IEEE Geoscience and Remote Sensing Letters, 2024, 21: 1–5. doi: 10.1109/LGRS.2023.3342904. [15] HU Peng, ZHEN Liangli, PENG Xi, et al. Deep supervised multi-view learning with graph priors[J]. IEEE Transactions on Image Processing, 2024, 33: 123–133. doi: 10.1109/TIP.2023.3335825. [16] CHEN Yucong. Analysis and forecasting of California housing[J]. Highlights in Business, Economics and Management, 2023, 3: 128–135. doi: 10.54097/hbem.v3i.4704. [17] BALTRUŠAITIS T, AHUJA C, and MORENCY L P. Multimodal machine learning: A survey and taxonomy[J]. IEEE Transactions on Pattern Analysis and Machine Intelligence, 2019, 41(2): 423–443. doi: 10.1109/TPAMI.2018.2798607. [18] USGS. https://earthexplorer.usgs.gov/, 2014. [19] GSCloud. Geospatial data cloud[EB/OL]. https://www.gscloud.cn/search, 2009. [20] EOC. Eoc geoservice[EB/OL]. https://download.geoservice.dlr.de/TDM90/, 2016. [21] ALOS. Aw3d30 dsm data map[EB/OL]. https://www.eorc.jaxa.jp/ALOS/en/aw3d30/data/index.htm, 2021. [22] NASA. Icesat-2 (ice, cloud, and land elevation satellite2)[EB/OL]. https://icesat-2.gsfc.nasa.gov/science/specs, 2018. [23] 王密, 韦钰, 杨博, 等. ICESat-2/ATLAS全球高程控制点提取与分析[J]. 武汉大学学报(信息科学版), 2021, 46(2): 184–192. doi: 10.13203/j.whugis20200531.WANG Mi, WEI Yu, YANG Bo, et al. Extraction and analysis of global elevation control points from ICESat-2 /ATLAS data[J]. Geomatics and Information Science of Wuhan University, 2021, 46(2): 184–192. doi: 10.13203/j.whugis20200531. [24] ESA. Esa worldcover 10m 2020[EB/OL]. https://esa-worldcover.org/en, 2020. [25] National Earth System Science Data Center. Global 30-meter fine surface coverage products[EB/OL]. https://doi.org/10.12041/geodata.4200772.ver1.db, 2015. [26] ZHU Simin, GUENDEL R G, YAROVOY A, et al. Continuous human activity recognition with distributed radar sensor networks and CNN-RNN architectures[J]. IEEE Transactions on Geoscience and Remote Sensing, 2022, 60: 5115215. doi: 10.1109/TGRS.2022.3189746. [27] QUADRIANTO N and GHAHRAMANI Z. A very simple safe-Bayesian random forest[J]. IEEE Transactions on Pattern Analysis and Machine Intelligence, 2015, 37(6): 1297–1303. doi: 10.1109/TPAMI.2014.2362751. [28] GEURTS P, ERNST D, and WEHENKEL L. Extremely randomized trees[J]. Machine Learning, 2006, 63(1): 3–42. doi: 10.1007/s10994-006-6226-1. [29] FUMERA G, ROLI F, and SERRAU A. A theoretical analysis of bagging as a linear combination of classifiers[J]. IEEE Transactions on Pattern Analysis and Machine Intelligence, 2008, 30(7): 1293–1299. doi: 10.1109/TPAMI.2008.30. -


 下载:
下载:


 下载:
下载:
