Convolutional Neural Network and Vision Transformer-driven Cross-layer Multi-scale Fusion Network for Hyperspectral Image Classification
-
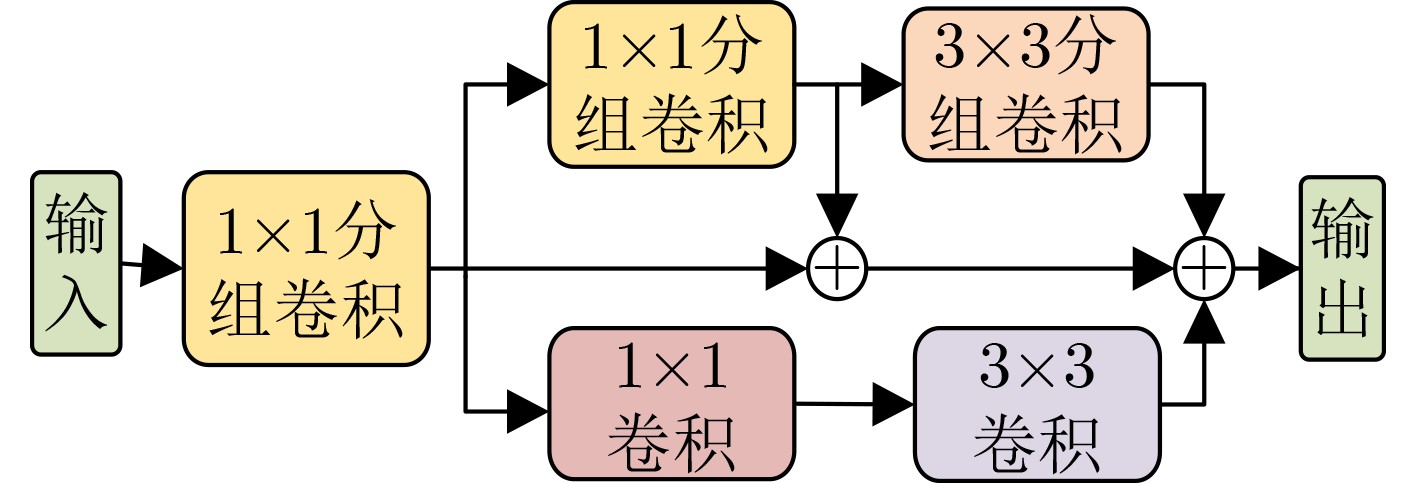
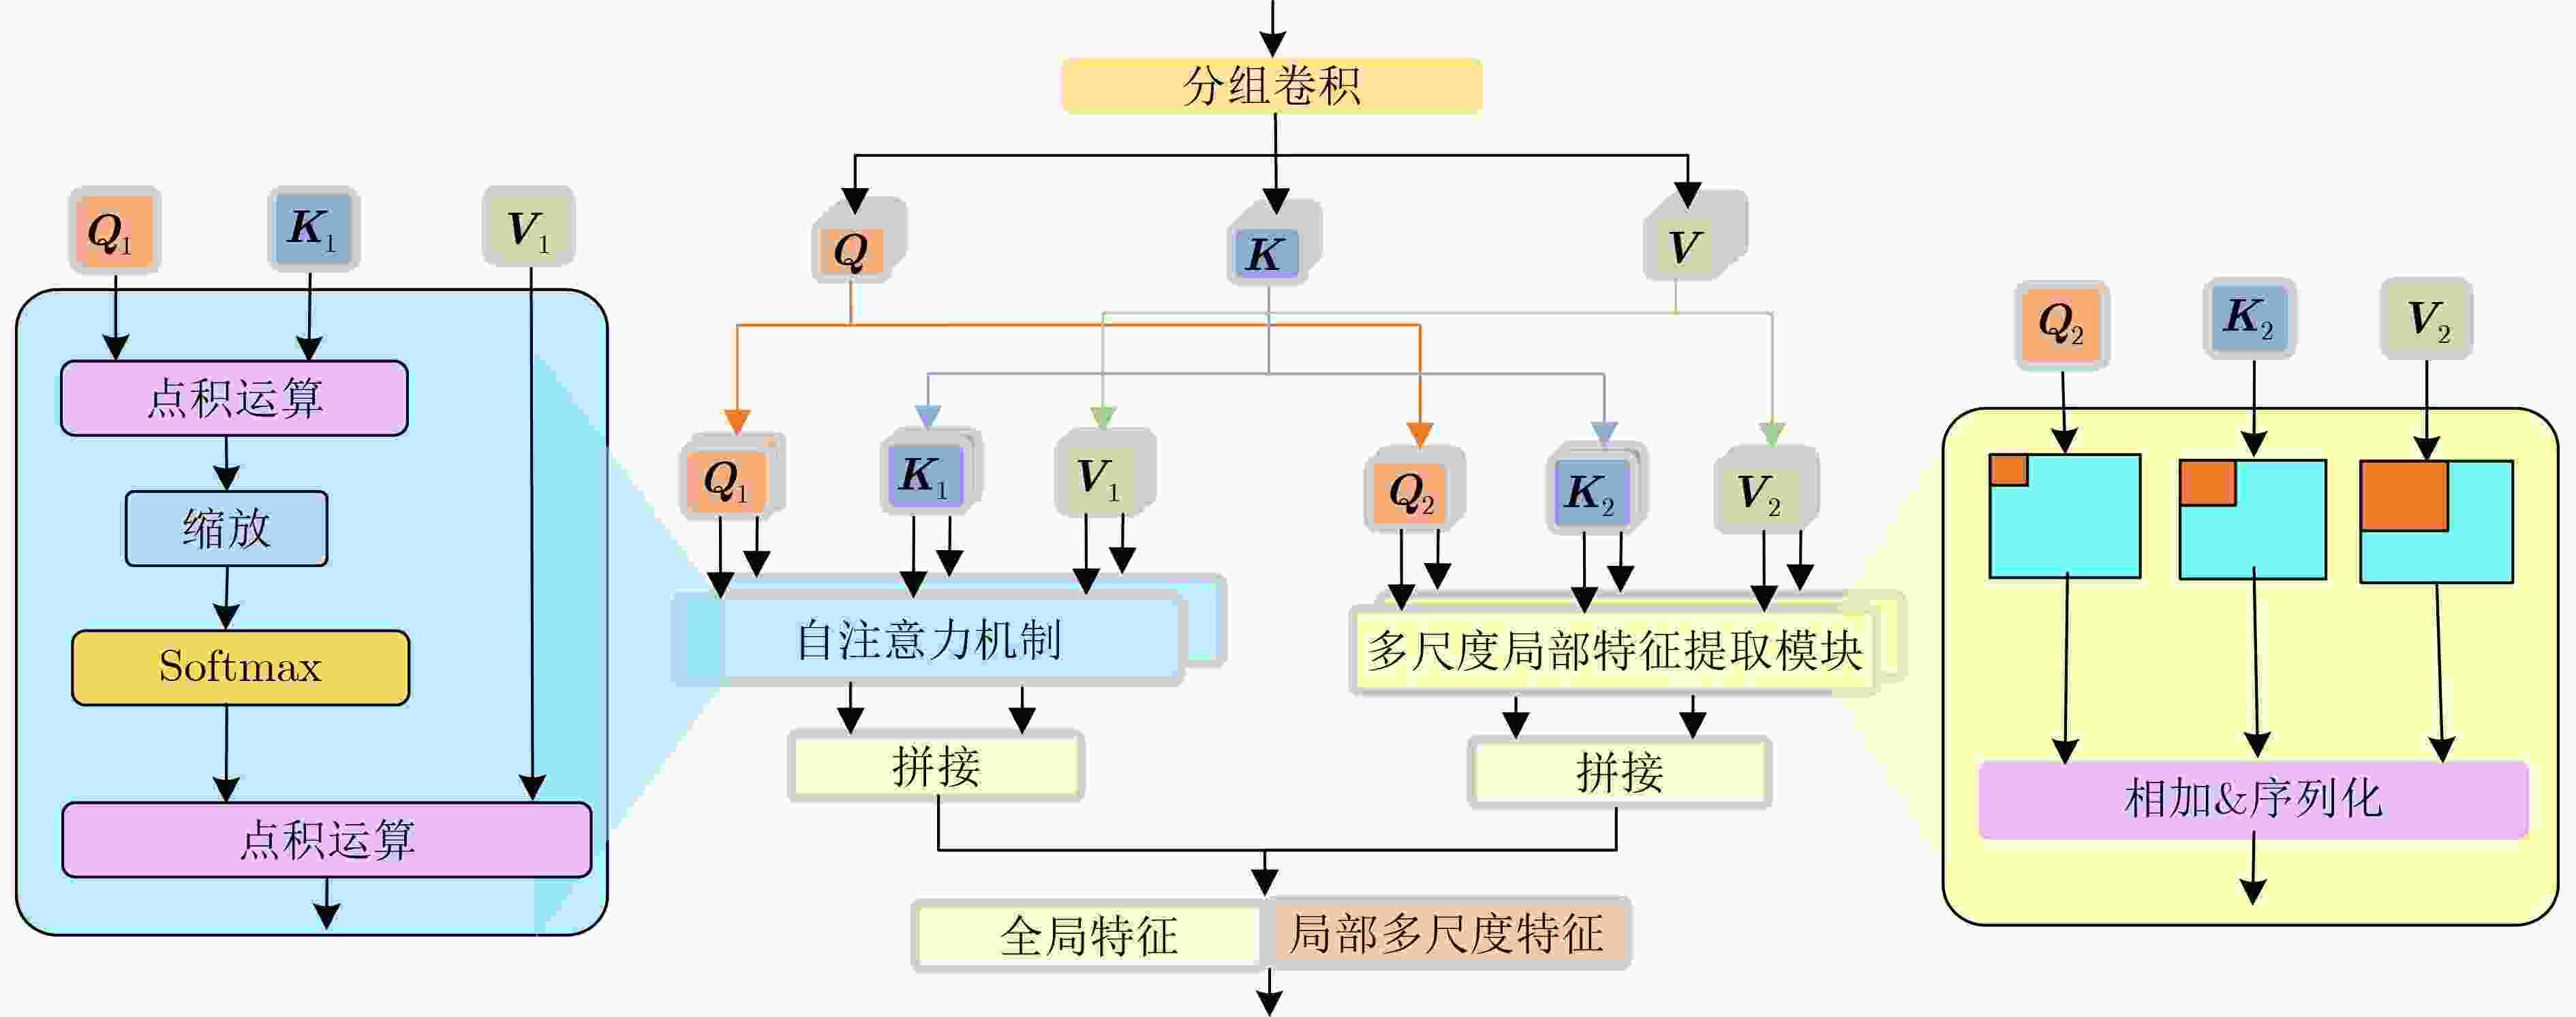
摘要: 高光谱图像(HSI)分类是地球科学和遥感影像处理任务中最受关注的研究热点之一。近年来,卷积神经网络(CNN)和视觉Transformer相结合的方法,通过综合考虑局部-全局信息,在HSI分类任务中取得了成功。然而,HSI中地物具有丰富的纹理信息和复杂多样的结构,且不同地物之间存在尺度差异。现有的二者结合的方法通常对多尺度地物目标的纹理和结构信息的提取能力有限。为了克服上述局限性,该文提出CNN与视觉Transformer联合驱动的跨层多尺度融合网络HSI分类方法。首先,从结合CNN与视觉Transformer的角度出发,设计了跨层多尺度局部-全局特征提取模块分支,其主要由卷积嵌入的视觉Transformer和跨层特征融合模块构成。具体来说,卷积嵌入的视觉Transformer通过深度融合多尺度CNN与视觉Transformer实现了多尺度局部-全局特征信息的有效提取,从而增强网络对不同尺度地物的关注。进一步地,跨层特征融合模块深度聚合了不同层次的多尺度局部-全局特征信息,以综合考虑地物的浅层纹理信息和深层结构信息。其次,构建了分组多尺度卷积模块分支来挖掘HSI中密集光谱波段潜在的多尺度特征。最后,为了增强网络对HSI中局部波段细节和整体光谱信息的挖掘,设计了残差分组卷积模块对局部-全局光谱特征进行提取。Indian Pines, Houston 2013和Salinas Valley 3个HSI数据集上的实验结果证实了所提方法的有效性。
-
关键词:
- 高光谱图像分类 /
- 卷积神经网络 /
- 视觉Transformer /
- 多尺度特征 /
- 融合网络
Abstract: HyperSpectral Image (HSI) classification is one of the most prominent research topics in geoscience and remote sensing image processing tasks. In recent years, the combination of Convolutional Neural Network (CNN) and vision transformer has achieved success in HSI classification tasks by comprehensively considering local-global information. Nevertheless, the ground objects of HSIs vary in scale, containing rich texture information and complex structures. The current methods based on the combination of CNN and vision transformer usually have limited capability to extract texture and structural information of multi-scale ground objects. To overcome the above limitations, a CNN and vision transformer-driven cross-layer multi-scale fusion network is proposed for HSI classification. Firstly, from the perspective of combining CNN and visual transformer, a cross-layer multi-scale local-global feature extraction module branch is constructed, which is composed of a convolution embedded vision transformer architecture and a cross-layer feature fusion module. Specifically, to enhance attention to multi-scale ground objects in HSIs, the convolution embedded vision transformer captures multi-scale local-global features effectively by organically combining multi-scale CNN and vision transformer. Furthermore, the cross-layer feature fusion module aggregates hierarchical multi-scale local-global features, thereby combining shallow texture information and deep structural information of ground objects. Secondly, a group multi-scale convolution module branch is designed to explore the potential multi-scale features from abundant spectral bands in HSIs. Finally, to mine local spectral details and global spectral information in HSIs, a residual group convolution module is designed to extract local-global spectral features. Experimental results on Indian Pines, Houston 2013, and Salinas Valley datasets confirm the effectiveness of the proposed method. -
表 1 IP, HU, SV数据集基本信息
数据集 尺寸 光谱范围(μm) 光谱维度 类别数目 采集设备 IP 145 × 145 0.45~2.5 200 16 AVIRIS HU 349 × 1905 0.364~1.064 144 15 ITRES CASI-1500 SV 512 × 217 0.4~2.5 204 16 AVIRIS 表 2 不同模块对网络分类性能的影响(%)
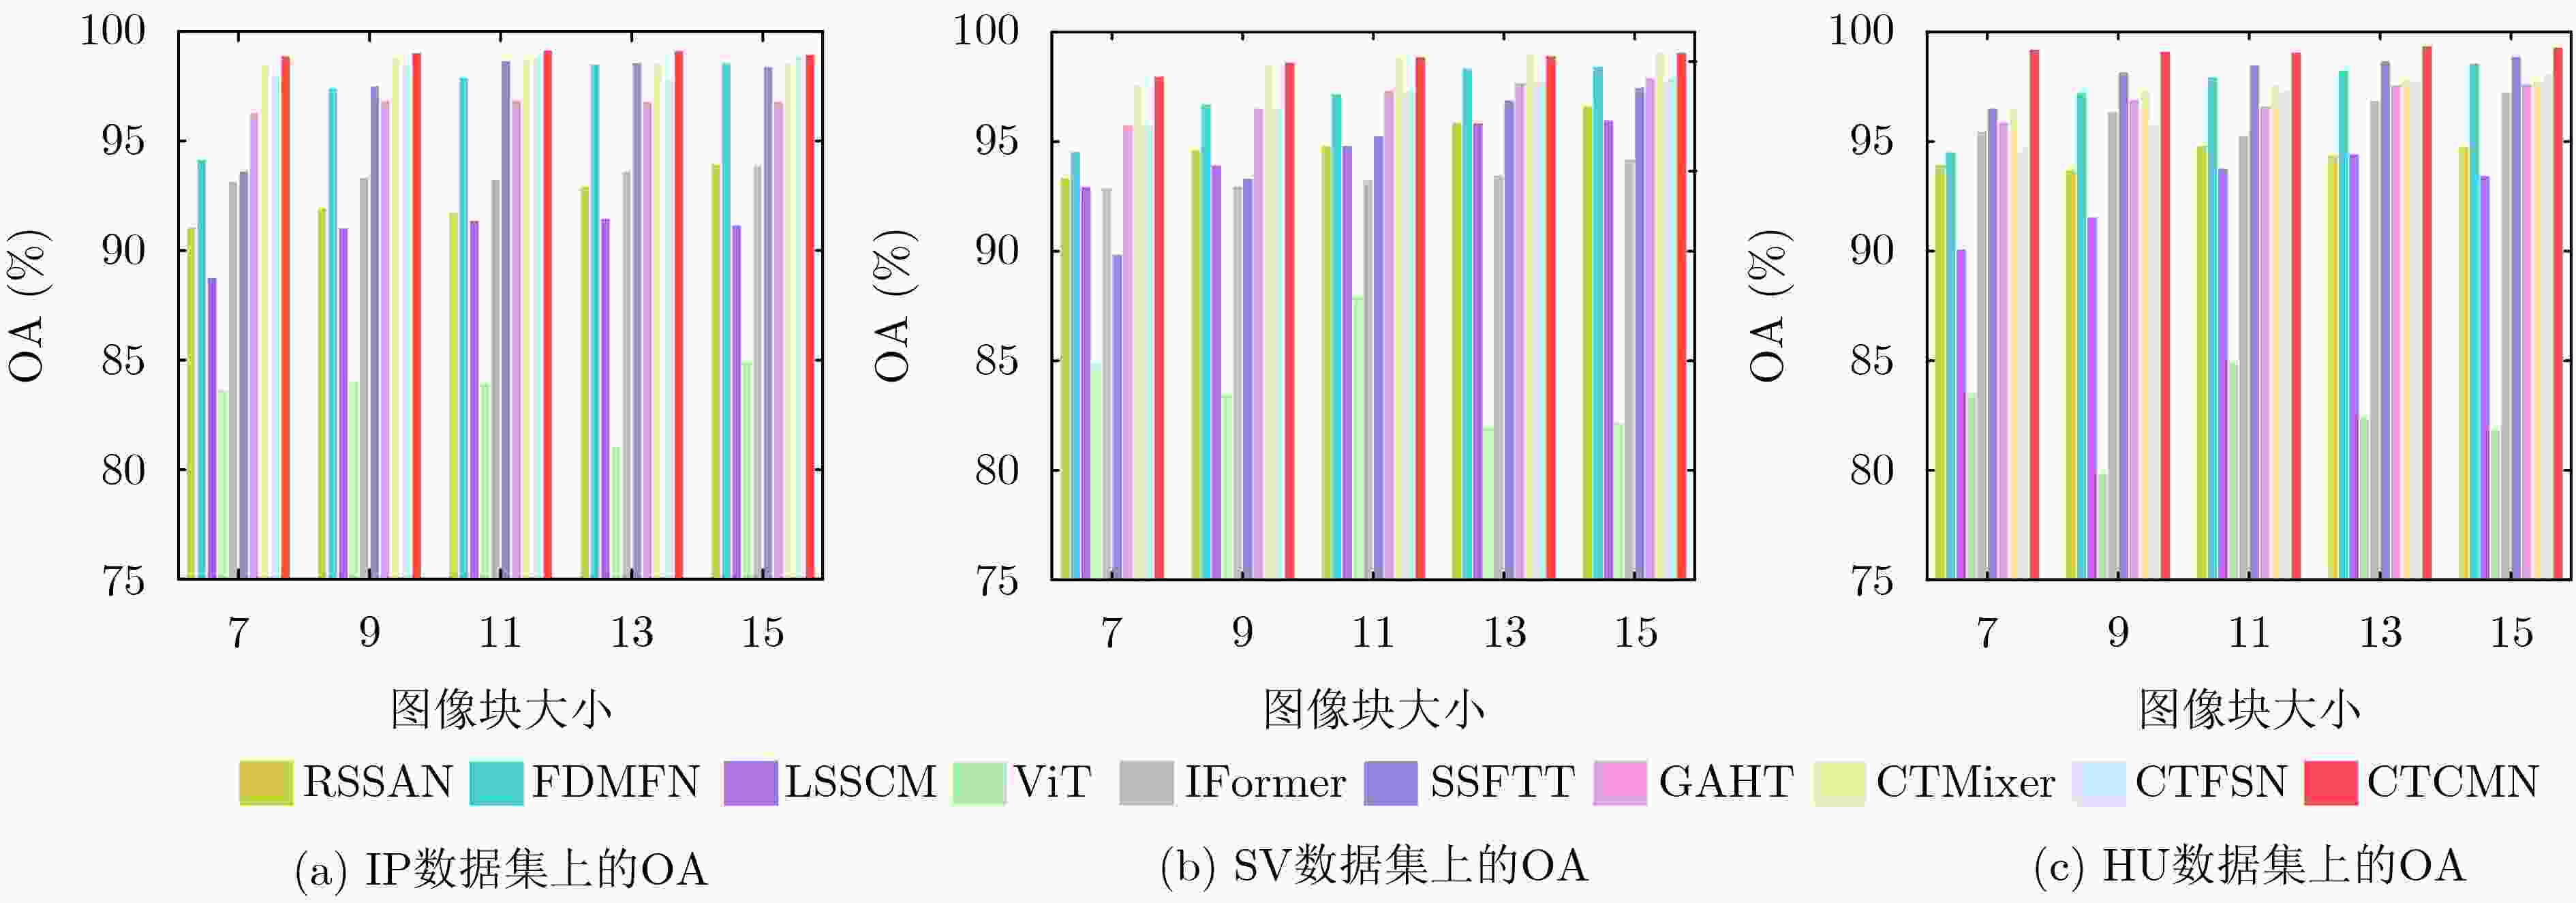
数据集 评价指标 网络 网络1 网络2 网络3 网络4 网络5 网络6 IP OA 83.94 ± 2.51 89.57 ± 0.51 98.66 ± 0.38 98.83 ± 0.25 98.91 ± 0.33 99.13 ± 0.16 AA 76.92 ± 4.70 83.09 ± 1.15 97.81 ± 1.48 97.90 ± 1.20 97.93 ± 1.06 98.38 ± 0.87 Kappa 81.60 ± 2.90 88.06 ± 0.59 98.47 ± 0.29 98.76 ± 0.37 98.76 ± 0.37 99.01 ± 0.19 SV OA 87.97 ± 1.80 91.06 ± 0.79 98.73 ± 0.32 98.80 ± 0.34 98.87 ± 0.29 98.89 ± 0.25 AA 91.04 ± 1.71 94.46 ± 0.79 99.22 ± 0.16 99.24 ± 0.12 99.26 ± 0.20 99.30 ± 0.21 Kappa 86.54 ± 2.03 90.03 ± 0.88 98.58 ± 0.36 98.65 ± 0.23 98.74 ± 0.33 98.77 ± 0.28 HU OA 84.99 ± 2.23 94.61 ± 0.44 98.85 ± 0.42 98.88 ± 0.43 98.90 ± 0.53 99.07 ± 0.22 AA 84.77 ± 2.31 93.38 ± 0.52 98.95 ± 0.37 98.96 ± 0.21 98.97 ± 0.49 99.09 ± 0.20 Kappa 83.76 ± 2.41 94.17 ± 0.48 98.76 ± 0.45 98.82 ± 0.51 98.99 ± 0.32 98.99 ± 0.24 表 3 IP数据集上不同方法的分类性能(%)
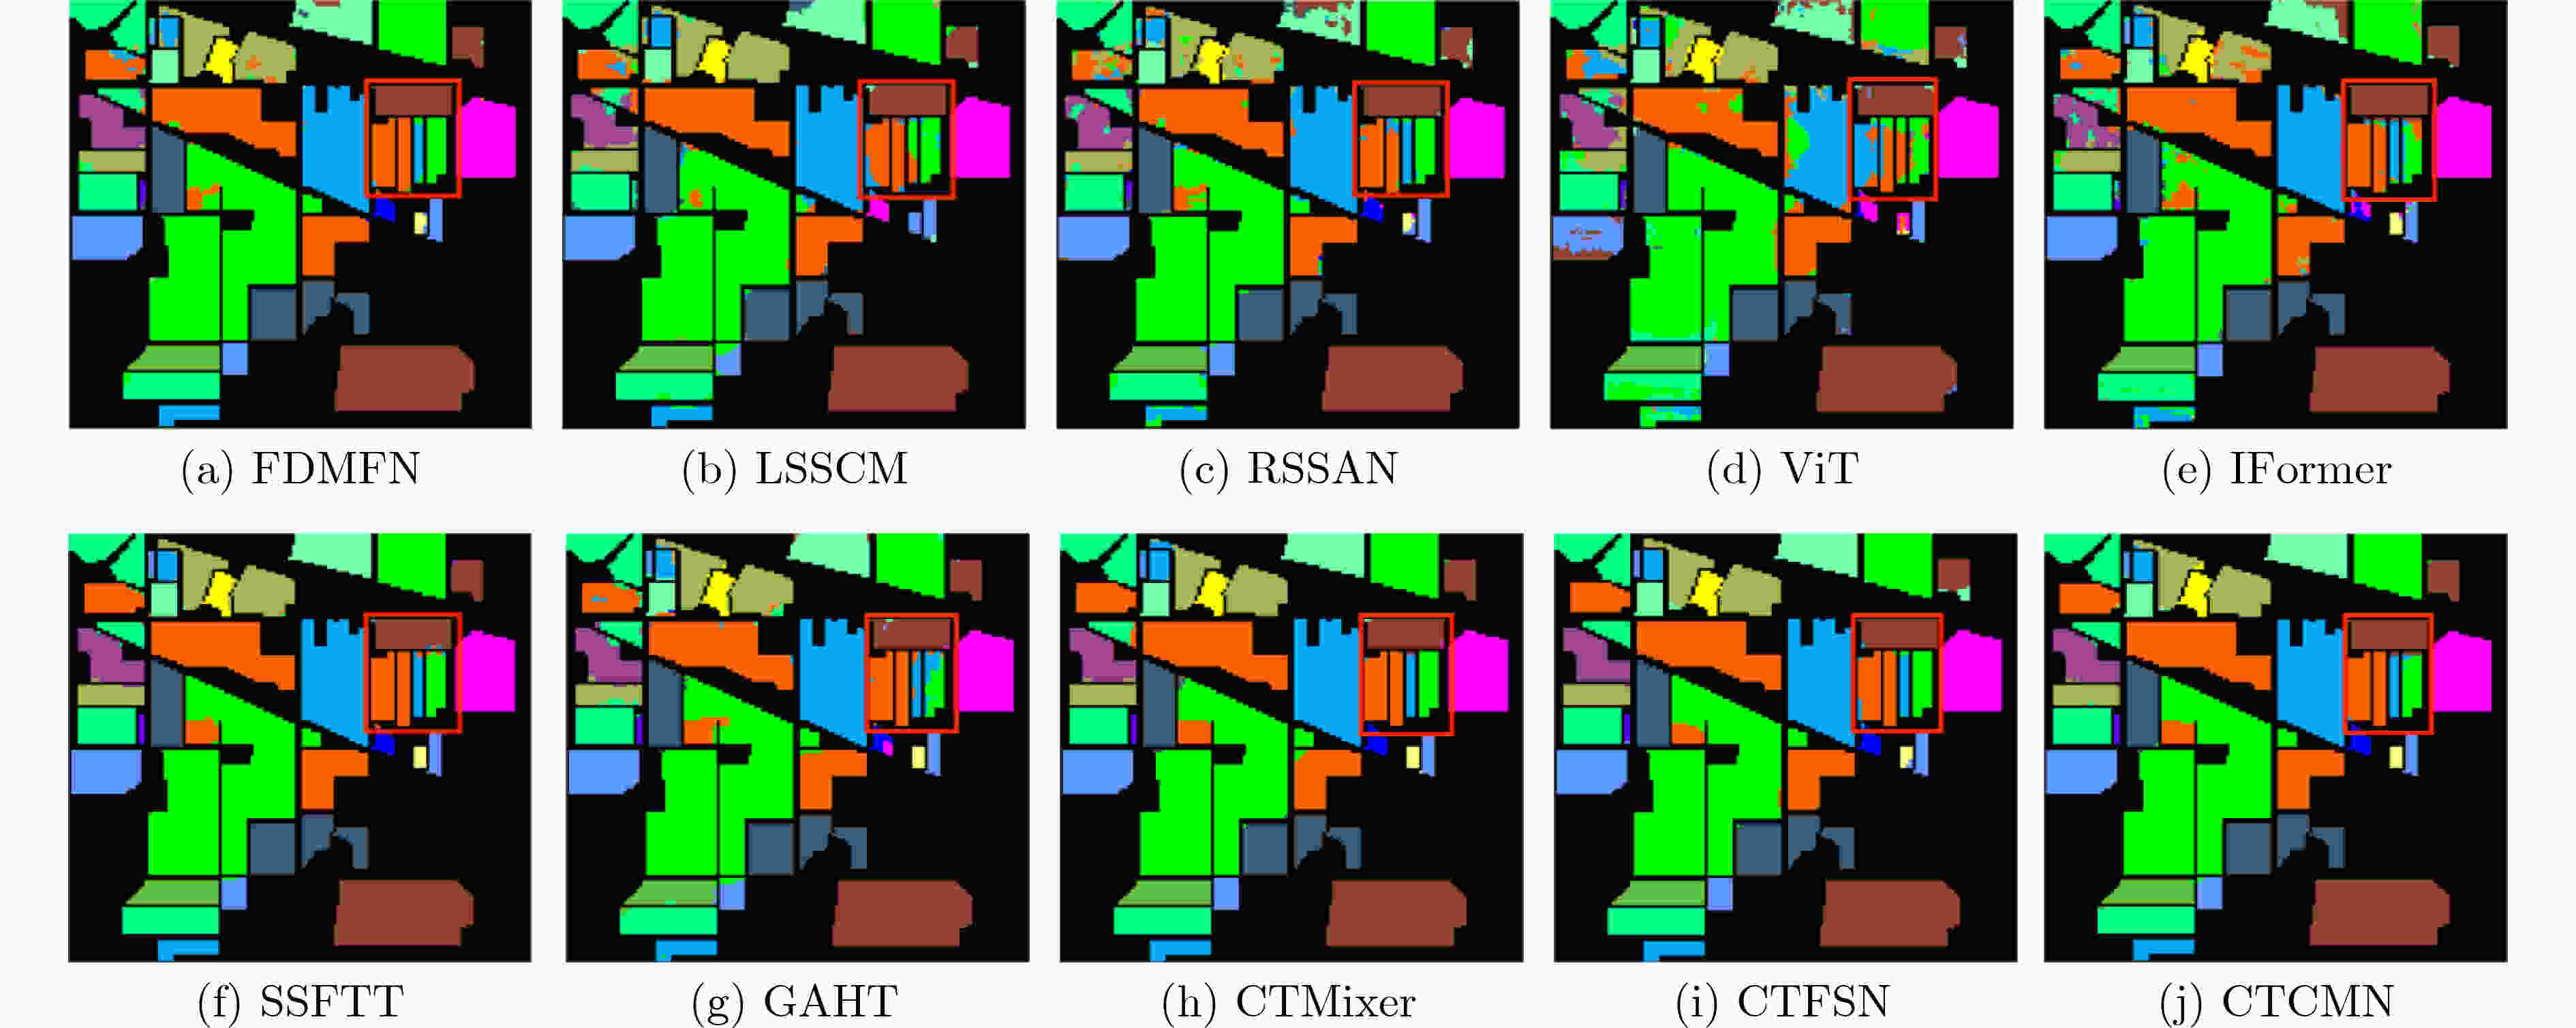
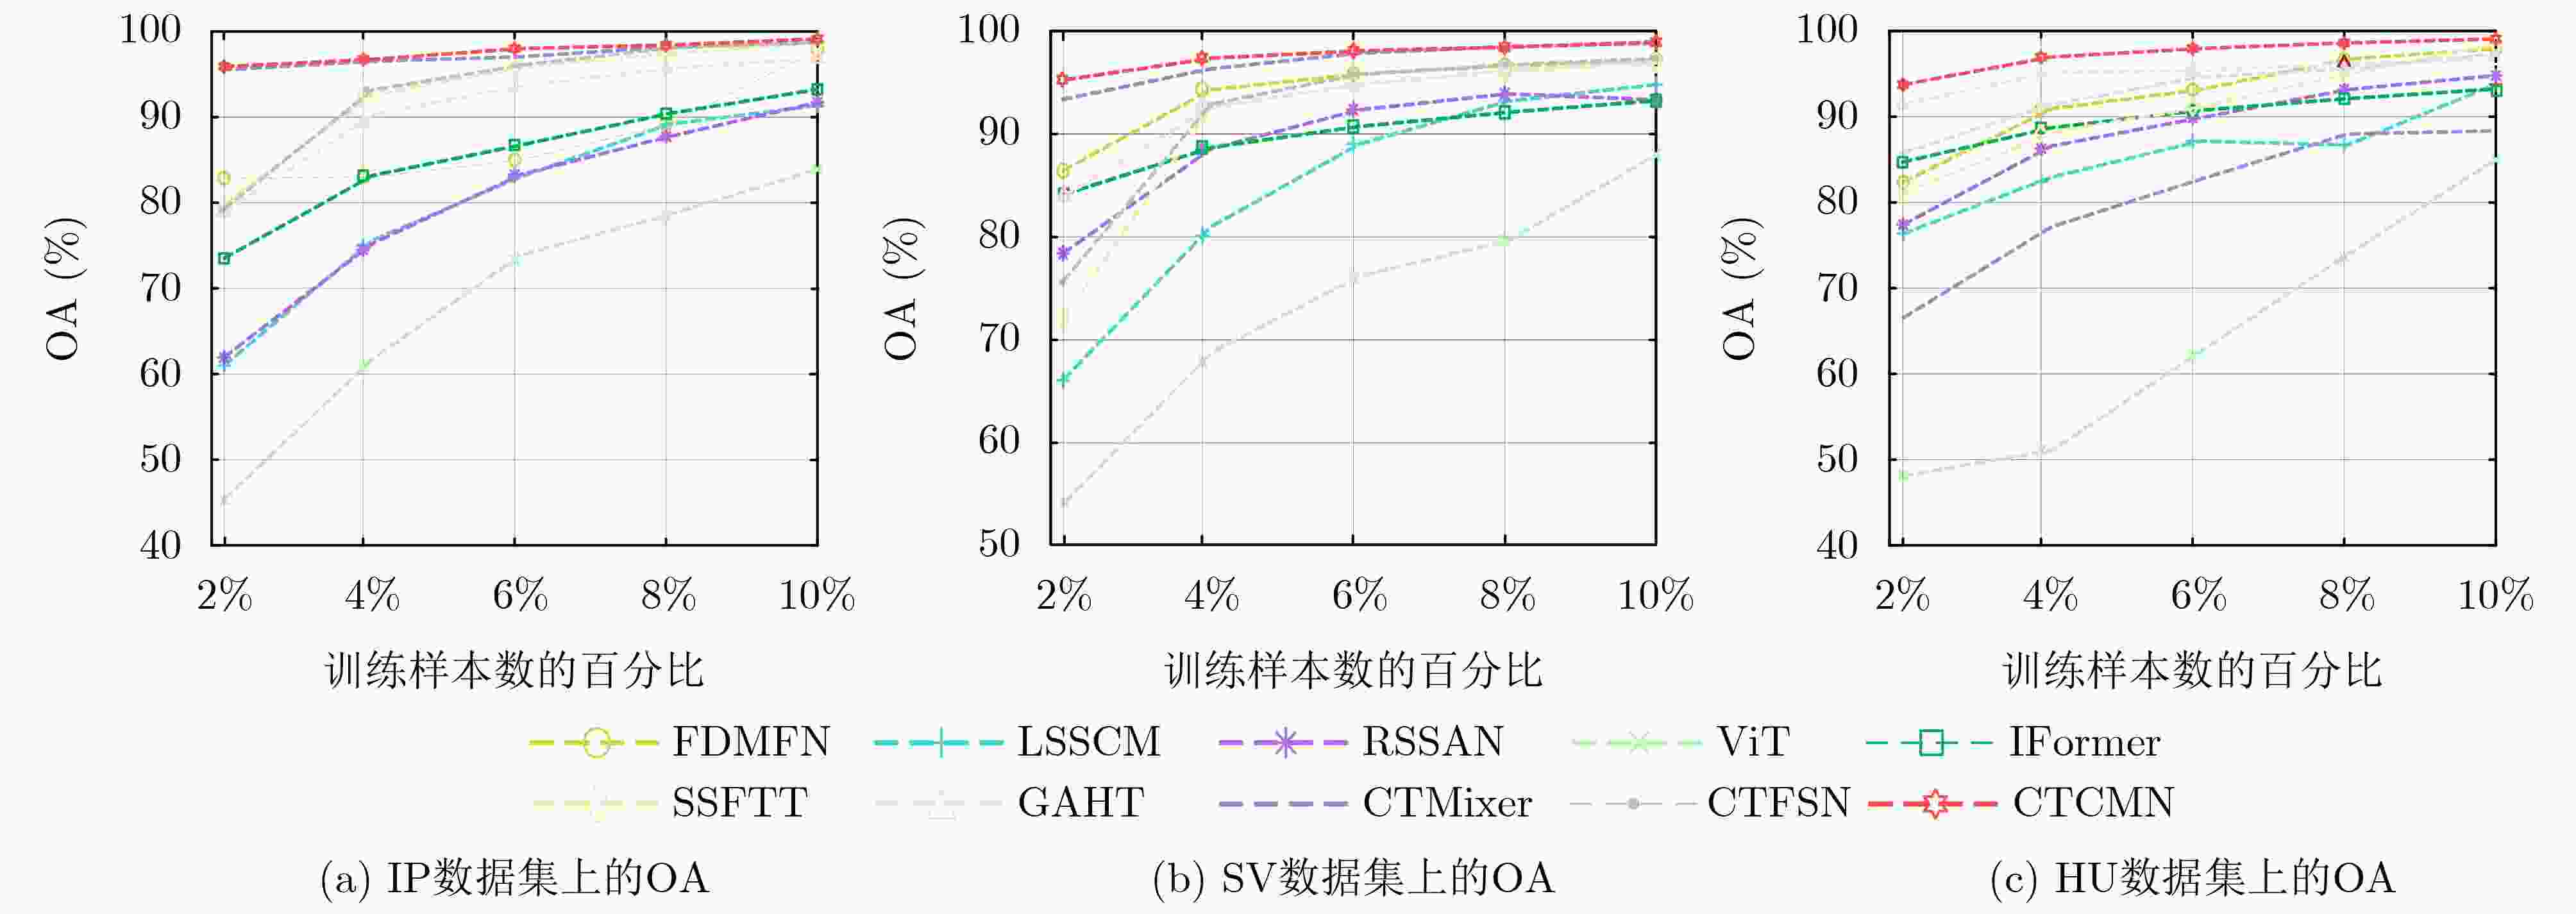
类别 FDMFN[10] LSSCM[12] RSSAN[11] ViT[15] IFormer[17] SSFTT[18] GAHT[19] CTMixer[20] CTFSN[21] CTCMN 1 88.05 58.78 65.12 23.66 63.66 94.15 78.78 94.63 93.17 96.83 2 97.06 86.62 90.73 76.10 89.32 99.04 96.14 98.58 98.54 99.06 3 97.82 88.07 89.33 79.83 93.81 98.39 97.54 98.66 98.45 98.94 4 96.41 87.11 70.00 82.49 81.66 98.08 93.22 98.78 97.85 98.32 5 97.04 89.38 93.06 72.97 94.74 98.09 96.08 96.61 97.96 97.82 6 98.98 88.01 98.16 98.71 98.89 99.67 99.54 99.27 99.62 99.62 7 88.00 66.92 68.00 54.80 64.80 95.20 91.60 96.40 93.60 94.40 8 99.95 89.85 99.67 99.98 99.86 100.0 99.86 100.0 100.0 100.0 9 92.22 20.53 47.78 42.22 65.56 76.67 85.56 90.56 94.44 97.78 10 97.44 88.05 91.15 68.73 92.38 98.52 96.35 98.49 98.52 99.12 11 99.08 95.25 95.14 89.18 96.60 99.45 97.54 99.06 99.20 99.40 12 92.92 84.54 79.25 66.73 81.47 95.66 92.49 97.23 97.92 98.09 13 99.95 97.79 98.75 99.95 99.67 100.0 98.04 99.67 100.0 99.51 14 98.84 94.78 97.43 96.03 98.78 99.06 98.05 99.54 99.24 99.80 15 97.43 84.23 75.91 79.41 80.88 96.55 95.82 99.39 97.31 99.05 16 97.86 96.19 83.81 100.0 93.57 95.71 90.12 97.14 96.67 96.79 OA 97.88 91.36 91.72 83.93 93.38 98.68 96.84 98.76 98.76 99.14 AA 96.19 75.85 83.95 76.92 87.22 96.51 94.17 97.75 97.65 98.40 Kappa 97.58 90.14 90.54 81.60 92.43 98.50 96.39 98.58 98.58 99.02 表 4 SV数据集上不同方法的分类性能(%)
类别 FDMFN[10] LSSCM[12] RSSAN[11] ViT[15] IFormer[17] SSFTT[18] GAHT[19] CTMixer[20] CTFSN[21] CTCMN 1 99.79 97.83 99.40 98.20 99.71 98.71 78.78 100.0 99.94 100.0 2 99.99 99.85 99.50 99.95 99.98 99.53 96.14 100.0 100.0 100.0 3 99.26 88.93 97.08 78.28 99.98 98.45 97.54 99.96 99.83 99.98 4 99.21 99.30 98.43 97.53 98.64 98.88 93.22 98.57 98.89 98.95 5 99.51 97.36 98.54 92.56 98.79 99.15 96.08 99.03 99.67 99.22 6 100.0 99.95 99.97 100.0 100.0 99.94 99.54 99.99 100.0 100.0 7 99.98 99.72 98.94 96.03 99.05 98.93 91.60 99.98 99.97 99.98 8 92.52 90.61 90.90 89.17 88.43 90.29 99.86 97.14 93.02 97.11 9 99.99 99.99 99.89 99.97 100.0 99.70 85.56 100.0 100.0 100.0 10 97.91 93.93 96.35 91.16 96.75 97.41 96.35 98.60 97.95 99.01 11 98.01 90.02 92.78 80.45 95.75 95.90 97.54 99.90 99.82 99.81 12 99.95 99.38 99.53 97.92 99.83 100.0 92.49 99.97 99.99 99.98 13 99.97 97.81 98.80 98.68 99.65 99.40 98.04 99.59 99.92 99.68 14 99.44 98.59 97.21 95.73 97.79 97.87 98.05 99.01 99.67 99.01 15 92.84 86.85 82.77 49.05 72.10 84.88 95.82 97.30 92.49 97.74 16 98.18 95.32 95.07 91.97 98.42 97.19 90.12 99.75 99.46 99.76 OA 97.15 94.80 91.72 87.97 93.24 95.24 96.84 98.82 97.32 98.93 AA 98.53 95.96 83.95 91.04 96.49 97.26 94.17 99.29 98.78 99.38 Kappa 96.83 94.21 90.54 86.54 94.70 94.70 96.39 98.69 97.02 98.80 表 5 HU数据集上不同方法的分类性能(%)
类别 FDMFN[10] LSSCM[12] RSSAN[11] ViT[15] IFormer[17] SSFTT[18] GAHT[19] CTMixer[20] CTFSN[21] CTCMN 1 99.06 96.87 97.41 89.47 98.43 99.02 95.82 97.88 98.65 99.26 2 99.35 97.02 99.55 96.63 99.35 99.43 95.96 97.69 98.92 99.60 3 99.89 99.62 99.52 95.90 99.97 99.94 99.81 99.54 99.70 99.87 4 96.14 92.58 97.51 94.26 97.47 97.96 95.38 96.18 95.63 99.30 5 99.98 99.66 99.38 99.49 99.96 99.95 99.79 99.94 99.94 100.0 6 96.75 87.29 85.45 86.13 90.17 96.34 95.68 98.39 96.85 99.11 7 97.14 91.48 94.21 87.80 95.59 97.60 95.94 97.32 97.77 98.35 8 95.23 86.08 90.45 61.32 89.45 95.70 92.59 96.04 93.81 97.26 9 95.86 87.59 92.05 79.05 94.02 97.47 95.19 96.12 94.21 98.25 10 99.54 96.03 96.24 79.38 98.34 99.54 98.79 99.88 97.72 100.0 11 97.20 90.41 92.38 77.41 96.22 98.91 97.18 96.74 96.69 99.24 12 98.45 94.03 96.12 80.59 95.66 97.77 95.30 96.48 97.54 98.94 13 94.93 91.26 83.55 47.23 95.19 97.99 95.83 93.63 94.64 97.20 14 100.0 99.84 99.19 96.91 99.97 100.0 100.0 100.0 99.95 100.0 15 99.98 99.92 99.81 100.0 100.0 99.97 100.0 99.93 100.0 100.0 OA 97.96 93.97 95.41 84.77 96.65 98.50 96.88 97.71 97.33 99.07 AA 97.77 94.21 94.85 83.76 96.42 98.34 96.33 97.41 97.47 99.09 Kappa 98.90 96.87 95.04 89.47 98.43 98.92 95.82 97.88 97.12 98.99 表 6 IP, SV和HU数据集上不同方法的参数量、训练时间和测试时间
数据集 评价指标 FDMFN LSSCM RSSAN ViT IFormer SSFTT GAHT CTMixer CTFSN CTCMN IP 参数量(M) 0.54 0.01 0.17 0.68 0.63 0.93 1.22 0.61 0.55 0.79 训练时间(s) 34.43 38.30 38.79 27.55 90.85 35.36 98.87 82.24 39.32 95.19 测试时间(s) 1.92 1.73 1.95 2.06 6.35 2.40 6.99 5.22 2.41 6.29 SV 参数量(M) 0.54 0.01 0.17 0.68 0.62 0.95 0.97 0.61 0.54 0.77 训练时间(s) 18.91 20.84 20.93 14.67 46.83 18.81 49.69 44.33 20.75 48.70 测试时间(s) 12.20 10.29 10.80 10.94 29.31 13.11 28.52 28.24 11.88 23.80 HU 参数量(M) 0.53 0.01 0.14 0.66 0.63 0.72 1.19 0.64 0.54 0.79 训练时间(s) 45.01 50.34 51.607 34.68 66.362 40.89 99.03 64.32 51.88 68.36 测试时间(s) 52.90 50.46 57.57 54.43 68.274 57.39 116.52 69.27 63.11 89.09 -
[1] BIOUCAS-DIAS J M, PLAZA A, CAMPS-VALLS G, et al. Hyperspectral remote sensing data analysis and future challenges[J]. IEEE Geoscience and Remote Sensing Magazine, 2013, 1(2): 6–36. doi: 10.1109/MGRS.2013.2244672. [2] KHAN I H, LIU Haiyan, LI Wei, et al. Early detection of powdery mildew disease and accurate quantification of its severity using hyperspectral images in wheat[J]. Remote Sensing, 2021, 13(18): 3612. doi: 10.3390/rs13183612. [3] SUN Mingyue, LI Qian, JIANG Xuzi, et al. Estimation of soil salt content and organic matter on arable land in the yellow river delta by combining UAV hyperspectral and landsat-8 multispectral imagery[J]. Sensors, 2022, 22(11): 3990. doi: 10.3390/s22113990. [4] STUART M B, MCGONIGLE A J S, and WILLMOTT J R. Hyperspectral imaging in environmental monitoring: A review of recent developments and technological advances in compact field deployable systems[J]. Sensors, 2019, 19(14): 3071. doi: 10.3390/s19143071. [5] BAZI Y and MELGANI F. Toward an optimal SVM classification system for hyperspectral remote sensing images[J]. IEEE Transactions on Geoscience and Remote Sensing, 2006, 44(11): 3374–3385. doi: 10.1109/TGRS.2006.880628. [6] GU Yanfeng, CHANUSSOT J, JIA Xiuping, et al. Multiple kernel learning for hyperspectral image classification: A review[J]. IEEE Transactions on Geoscience and Remote Sensing, 2017, 55(11): 6547–6565. doi: 10.1109/TGRS.2017.2729882. [7] LICCIARDI G A and CHANUSSOT J. Nonlinear PCA for visible and thermal hyperspectral images quality enhancement[J]. IEEE Geoscience and Remote Sensing Letters, 2015, 12(6): 1228–1231. doi: 10.1109/LGRS.2015.2389269. [8] ROY S K, KRISHNA G, DUBEY S R, et al. HybridSN: Exploring 3-D–2-D CNN feature hierarchy for hyperspectral image classification[J]. IEEE Geoscience and Remote Sensing Letters, 2020, 17(2): 277–281. doi: 10.1109/LGRS.2019.2918719. [9] GONG Zhiqiang, ZHONG Ping, YU Yang, et al. A CNN with multiscale convolution and diversified metric for hyperspectral image classification[J]. IEEE Transactions on Geoscience and Remote Sensing, 2019, 57(6): 3599–3618. doi: 10.1109/TGRS.2018.2886022. [10] MENG Zhe, LI Lingling, JIAO Licheng, et al. Fully dense multiscale fusion network for hyperspectral image classification[J]. Remote Sensing, 2019, 11(22): 2718. doi: 10.3390/rs11222718. [11] ZHU Minghao, JIAO Licheng, LIU Fang, et al. Residual spectral–spatial attention network for hyperspectral image classification[J]. IEEE Transactions on Geoscience and Remote Sensing, 2021, 59(1): 449–462. doi: 10.1109/TGRS.2020.2994057. [12] MENG Zhe, JIAO Licheng, LIANG Miaomiao, et al. A lightweight spectral-spatial convolution module for hyperspectral image classification[J]. IEEE Geoscience and Remote Sensing Letters, 2022, 19: 5505105. doi: 10.1109/LGRS.2021.3069202. [13] 刘娜, 李伟, 陶然. 图信号处理在高光谱图像处理领域的典型应用[J]. 电子与信息学报, 2023, 45(5): 1529–1540. doi: 10.11999/JEIT220887.LIU Na, LI Wei, and TAO Ran. Typical application of graph signal processing in hyperspectral image processing[J]. Journal of Electronics & Information Technology, 2023, 45(5): 1529–1540. doi: 10.11999/JEIT220887. [14] HONG Danfeng, GAO Lianru, YAO Jing, et al. Graph convolutional networks for hyperspectral image classification[J]. IEEE Transactions on Geoscience and Remote Sensing, 2021, 59(7): 5966–5978. doi: 10.1109/TGRS.2020.3015157. [15] DOSOVITSKIY A, BEYER L, KOLESNIKOV A, et al. An image is worth 16x16 words: Transformers for image recognition at scale[C/OL]. 9th International Conference on Learning Representations, 2021. https://arxiv.org/abs/2010.11929v1. [16] HONG Danfeng, HAN Zhu, YAO Jing, et al. SpectralFormer: Rethinking hyperspectral image classification with transformers[J]. IEEE Transactions on Geoscience and Remote Sensing, 2022, 60: 5518615. doi: 10.1109/TGRS.2021.3130716. [17] REN Qi, TU Bing, LIAO Sha, et al. Hyperspectral image classification with IFormer network feature extraction[J]. Remote Sensing, 2022, 14(19): 4866. doi: 10.3390/rs14194866. [18] SUN Le, ZHAO Guangrui, ZHENG Yuhui, et al. Spectral-spatial feature tokenization transformer for hyperspectral image classification[J]. IEEE Transactions on Geoscience and Remote Sensing, 2022, 60: 5522214. doi: 10.1109/TGRS.2022.3144158. [19] MEI Shaohui, SONG Chao, MA Mingyang, et al. Hyperspectral image classification using group-aware hierarchical transformer[J]. IEEE Transactions on Geoscience and Remote Sensing, 2022, 60: 5539014. doi: 10.1109/TGRS.2022.3207933. [20] ZHANG Junjie, MENG Zhe, ZHAO Feng, et al. Convolution transformer mixer for hyperspectral image classification[J]. IEEE Geoscience and Remote Sensing Letters, 2022, 19: 6014205. doi: 10.1109/LGRS.2022.3208935. [21] ZHAO Feng, LI Shijie, ZHANG Junjie, et al. Convolution transformer fusion splicing network for hyperspectral image classification[J]. IEEE Geoscience and Remote Sensing Letters, 2023, 20: 5501005. doi: 10.1109/LGRS.2022.3231874. [22] LIU Na, LI Wei, SUN Xian, et al. Remote sensing image fusion with task-inspired multiscale nonlocal-attention network[J]. IEEE Geoscience and Remote Sensing Letters, 2023, 20: 5502505. doi: 10.1109/LGRS.2023.3254049. [23] YANG Jiaqi, DU Bo, and WU Chen. Hybrid vision transformer model for hyperspectral image classification[C]. IGARSS 2022 - 2022 IEEE International Geoscience and Remote Sensing Symposium, Kuala Lumpur, Malaysia, 2022: 1388–1391. doi: 10.1109/IGARSS46834.2022.9884262. [24] SANDLER M, HOWARD A, ZHU Menglong, et al. MobileNetV2: Inverted residuals and linear bottlenecks[C]. The IEEE/CVF Conference on Computer Vision and Pattern Recognition, Salt Lake City, USA, 2018: 4510–4520. doi: 10.1109/CVPR.2018.00474. [25] WANG Qilong, WU Banggu, ZHU Pengfei, et al. ECA-Net: Efficient channel attention for deep convolutional neural networks[C]. The IEEE Conference on Computer Vision and Pattern Recognition, Seattle, USA, 2020: 11531–11539. doi: 10.1109/CVPR42600.2020.01155. -


 下载:
下载:





 下载:
下载:
