Feature Extraction and Analysis of fNIRS Signals Based on Linear Mapping Field
-
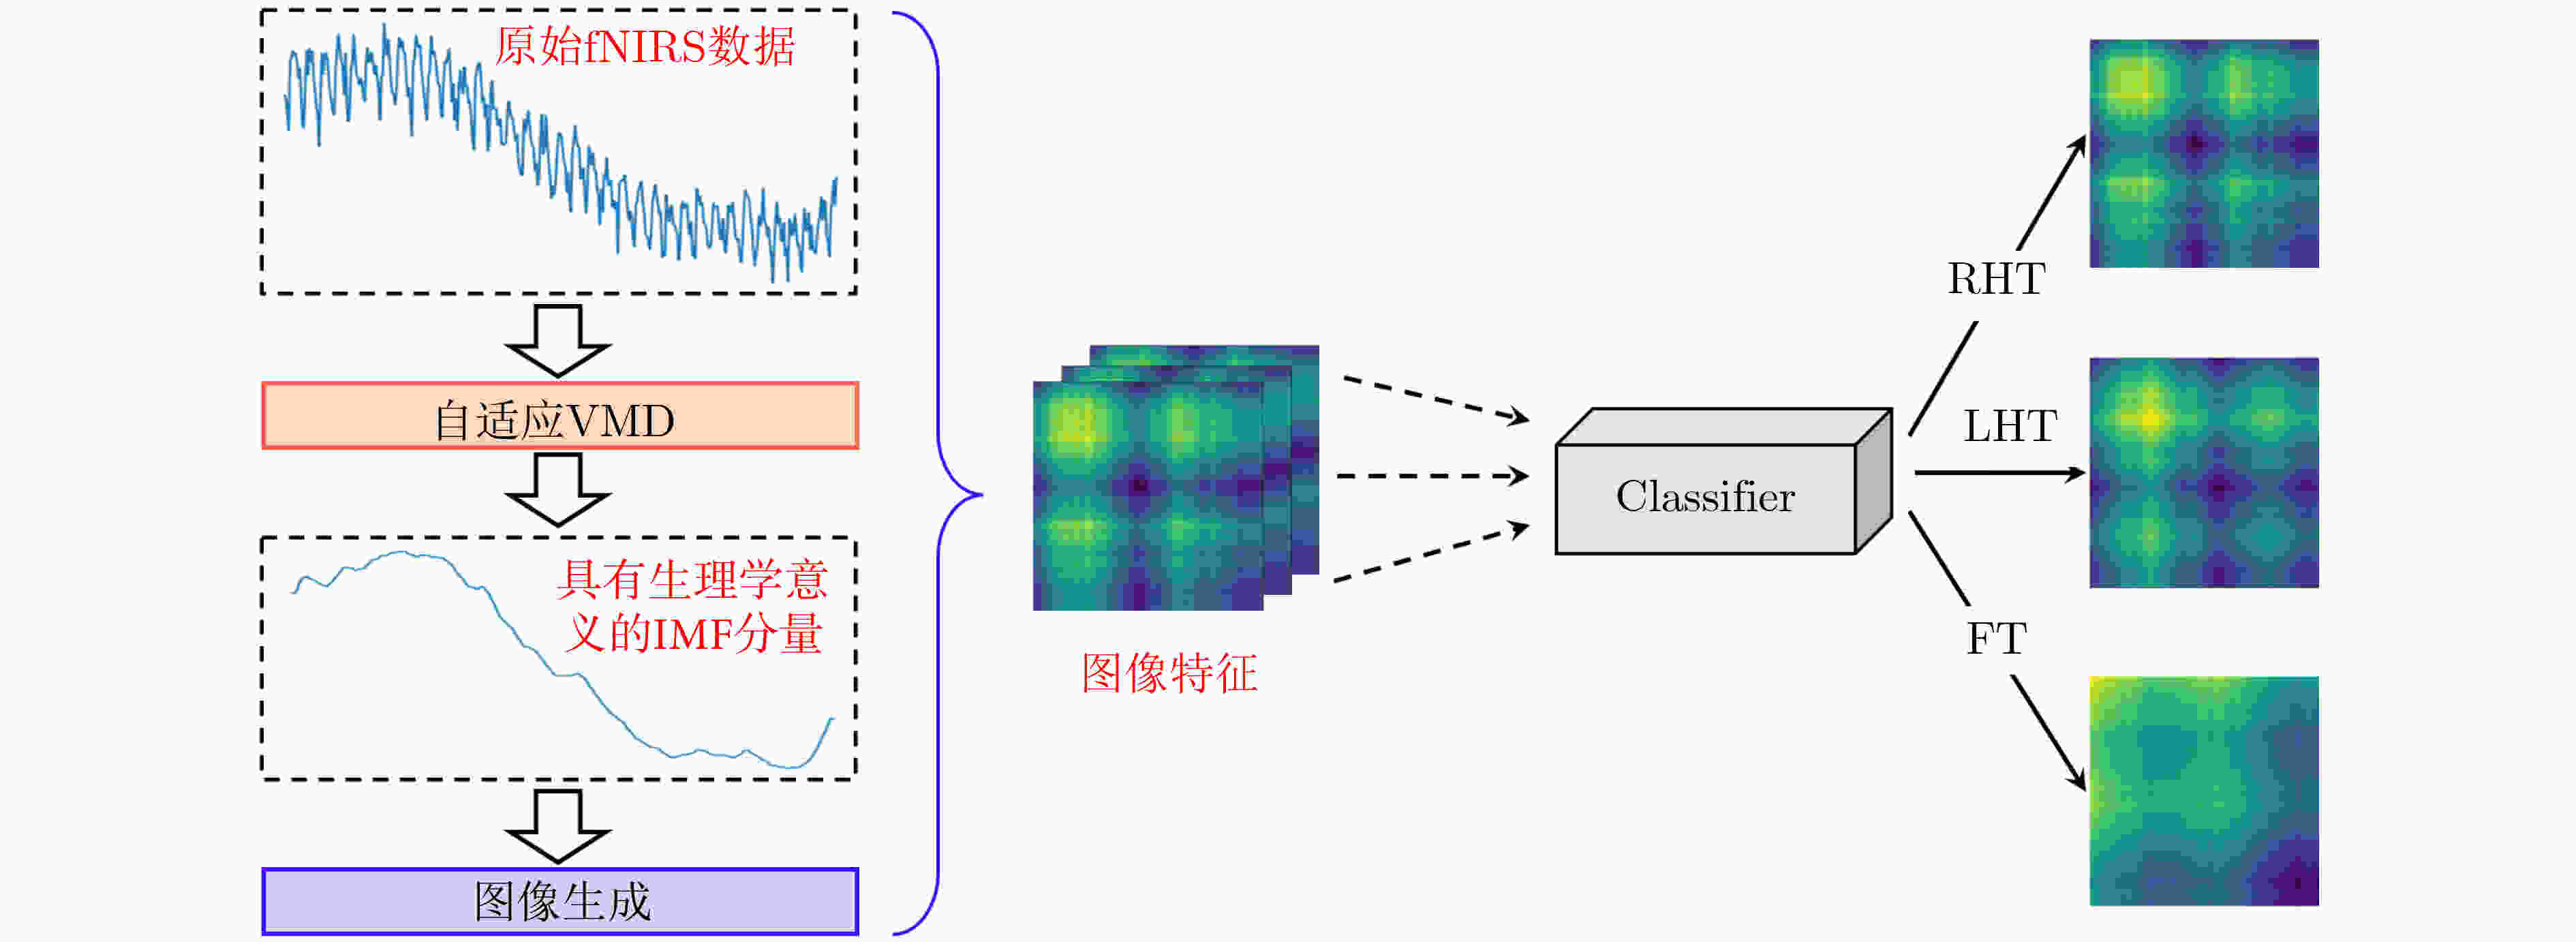
摘要: 大脑功能性激活的相关研究普遍存在特征提取依赖人工经验、深层次生理学信息难以挖掘两大问题。针对这两个问题,该文通过引入变分模态分解(VMD)技术,提出自适应VMD算法。该算法考虑了脑血氧信号在不同频段下的生理意义,降低了传统VMD对超参数选取的依赖。实验结果表明自适应VMD算法能够精确地提取出功能性近红外光谱(fNIRS)中富有生理学意义的有效模态分量,进而提升数据预处理效果。在此基础上,基于将时间序列映射成图像并使用深度卷积神经网络进行特征学习的思路,提出线性映射场(LMF)。基于LMF,该文以较低的运算量将fNIRS序列映射成2维图像,辅以深度卷积神经网络,实现了fNIRS生理信号深层次特征的提取。实验结果证明了所提出LMF的优势。最后,该文对提出方法的有效性进行了讨论与分析,说明了不同于循环神经网络仅能“顺序”地感知时间序列,卷积神经网络对时间序列的“跳跃”感知是其取得优异效果的关键。Abstract: There are two major problems in the research on brain functional activation: feature extraction relies on experience; and it is difficult to mine deep physiological information. Focusing on these two problems, this paper proposes a self-adaptive Variational Mode Decomposition (VMD) algorithm by introducing the VMD technique. The algorithm considers the physiological significance of cerebral blood oxygen signals in different frequency bands and reduces the dependence on the selection of hyperparameters. The experimental results show that the self-adaptive VMD algorithm can accurately extract meaningful components in functional Near-InfraRed Spectroscopy (fNIRS), thereby improving the effect of preprocessing. Secondly, this paper proposes Linear Mapping Field (LMF) based on the idea of mapping time series into images and using deep convolutional neural networks for learning. Based on LMF, this paper maps the fNIRS sequence into a two-dimensional image with a low amount of computation supplemented by a deep convolutional neural network, and realizes the extraction of deep features of fNIRS physiological signals. The experimental results demonstrate the performance and advantages of the proposed LMF. Finally, this paper discusses and analyzes the effectiveness of the proposed methods, indicating that different from recurrent neural networks which can only perceive the time series in a “sequential” manner, the convolutional neural networks’ characteristic of "jumping" perception is the key to achieving excellent results.
-
表 1 脑血氧信号在各频段的生理意义
频段 频率范围(Hz) 生理意义 I 0.6~2 心率活动 II 0.145~0.6 呼吸活动 III 0.052~0.145 肌源性活动 IV 0.021~0.052 神经性活动 V 0.0095~0.021 内皮细胞代谢活动 VI 0.005~0.0095 内皮细胞活动 表 2 传统机器学习算法应用于本数据集的分类结果
算法 三分类准确度(%) 对数几率回归 49.71 随机森林 67.85 支持向量机 74.97 Adaboost 62.42 朴素贝叶斯 51.64 决策树 53.32 多层感知机 73.37 线性判别分析 58.71 二次判别分析 65.95 表 3 两种不同fNIRS信号下7种典型的时间序列特征对比
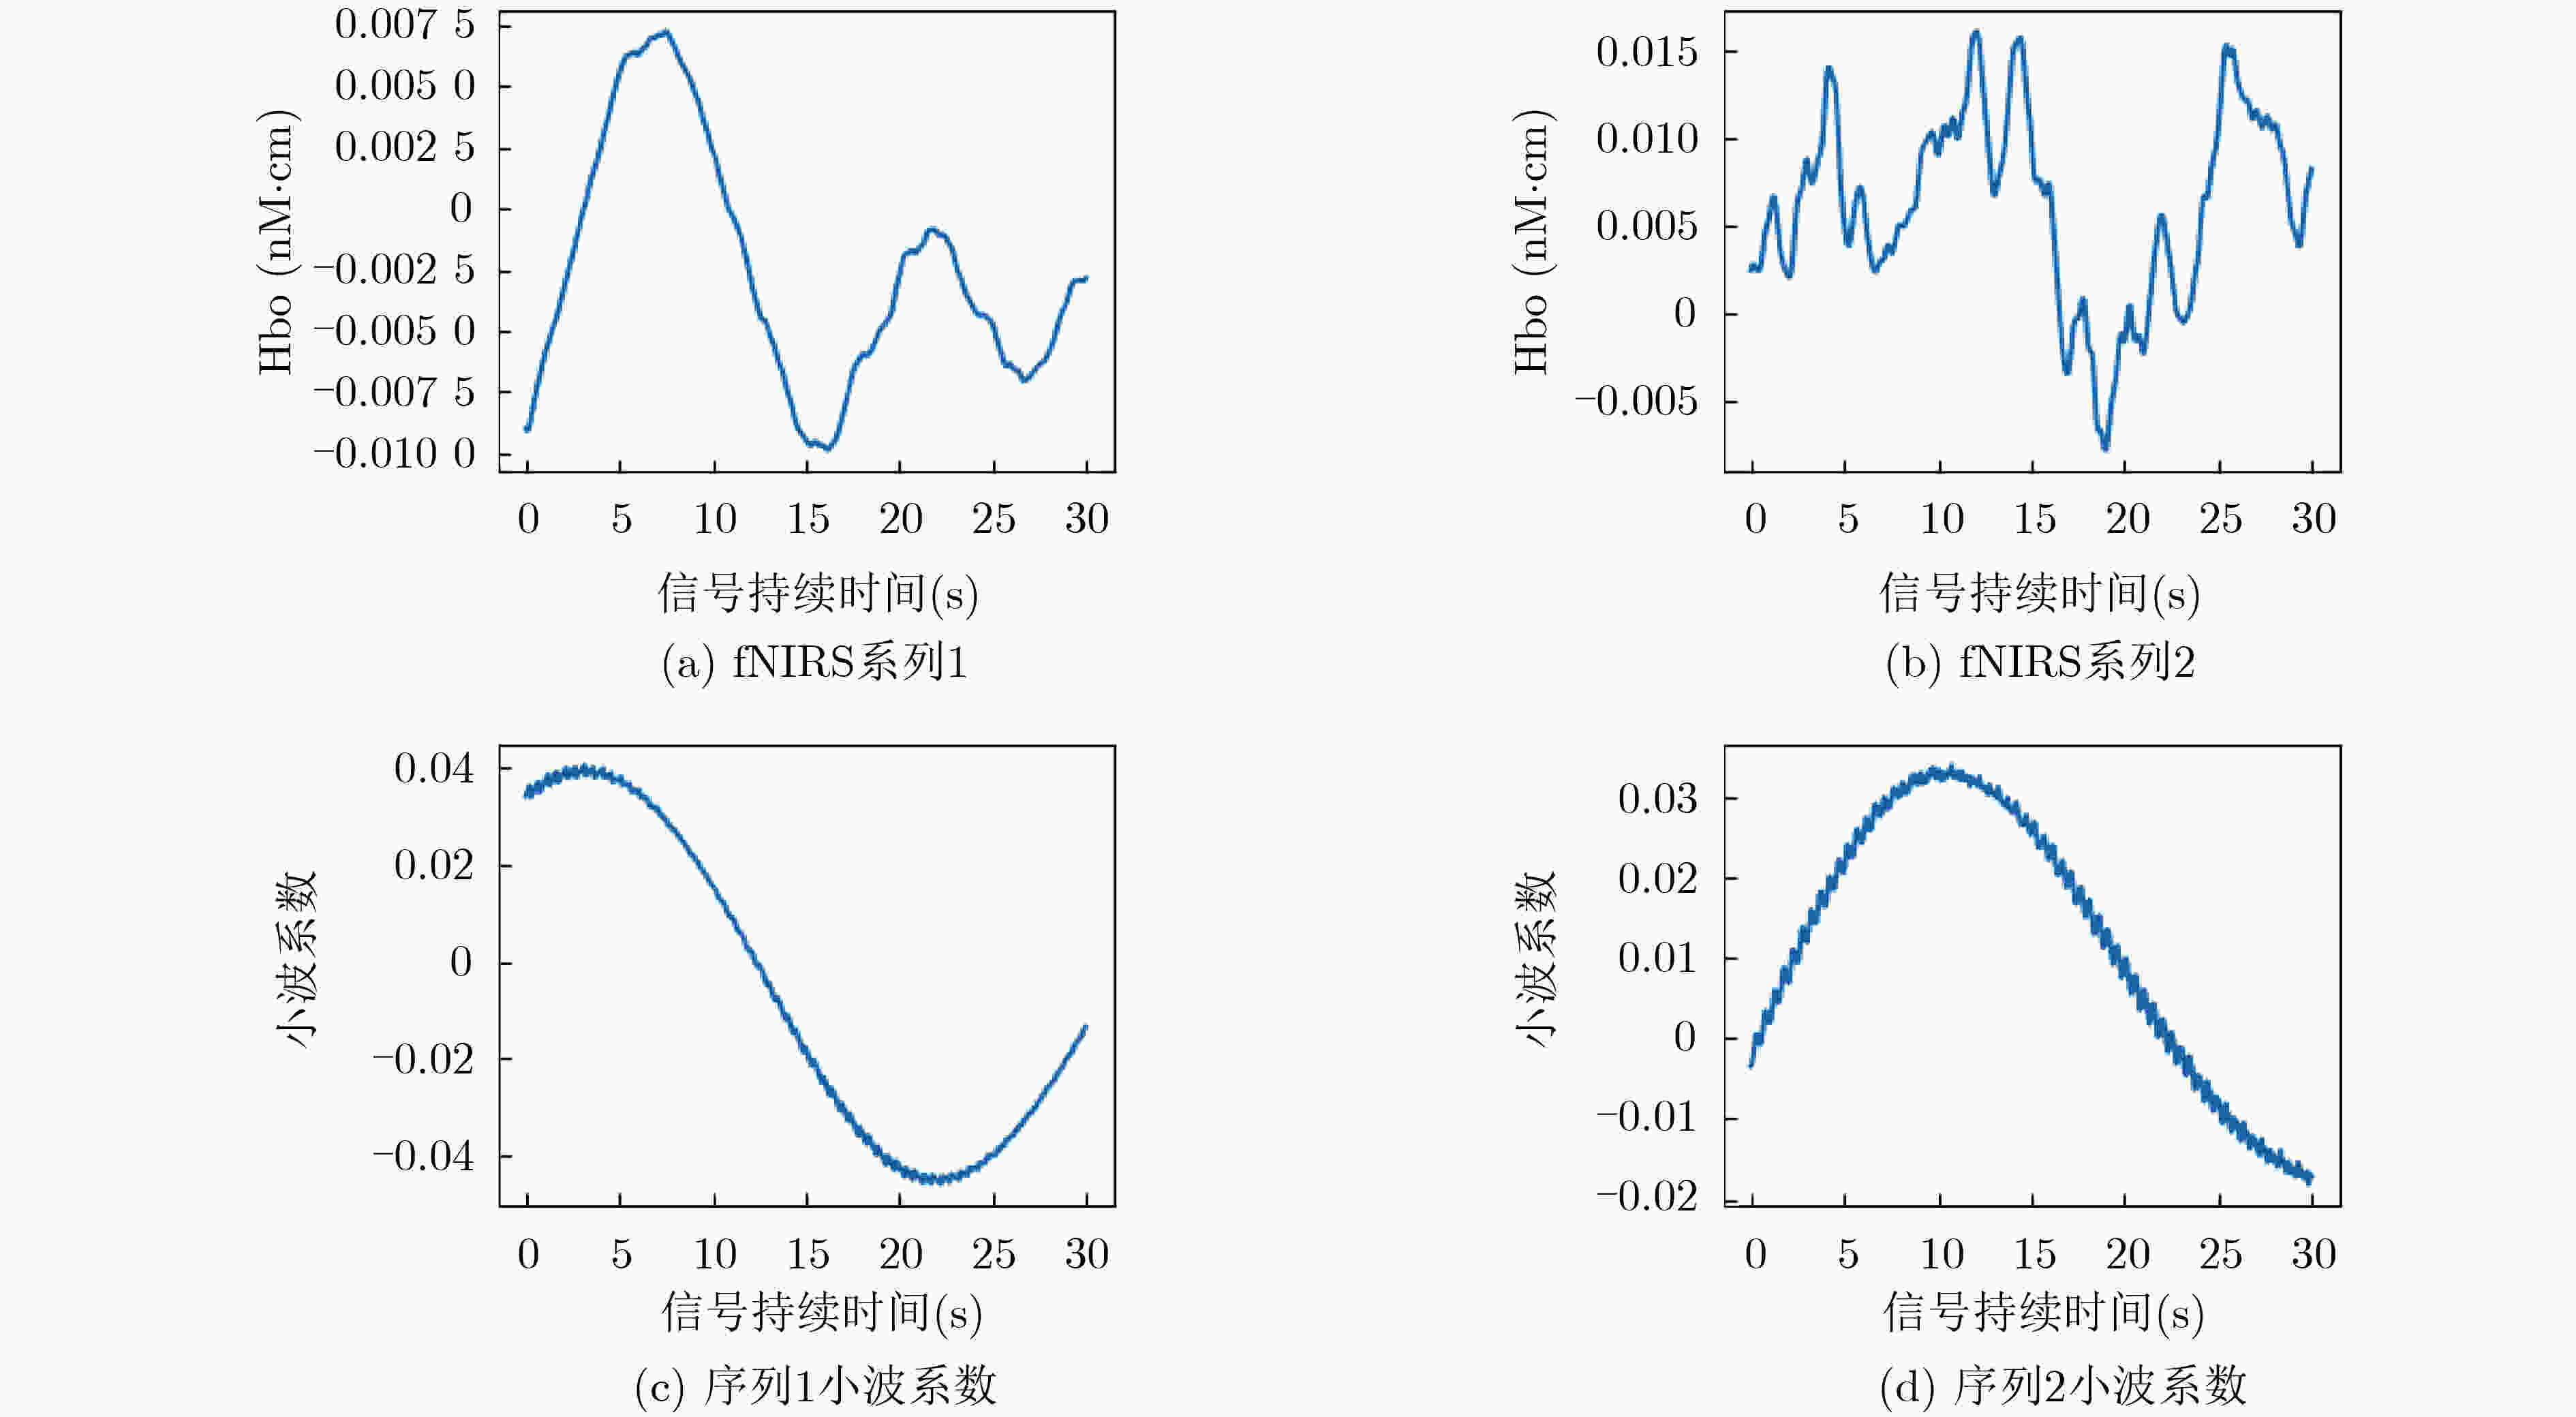
最小值 最大值 峰峰值 均值 中位值 偏度 峰度 信号1 –0.0099 0.0072 0.0171 –0.0025 –0.0035 0.5575 –0.7113 信号2 –0.0078 0.0160 0.0238 0.0060 0.0065 –0.2932 –0.4681 表 4 不同图像生成算法及图像尺寸的分类结果(%)
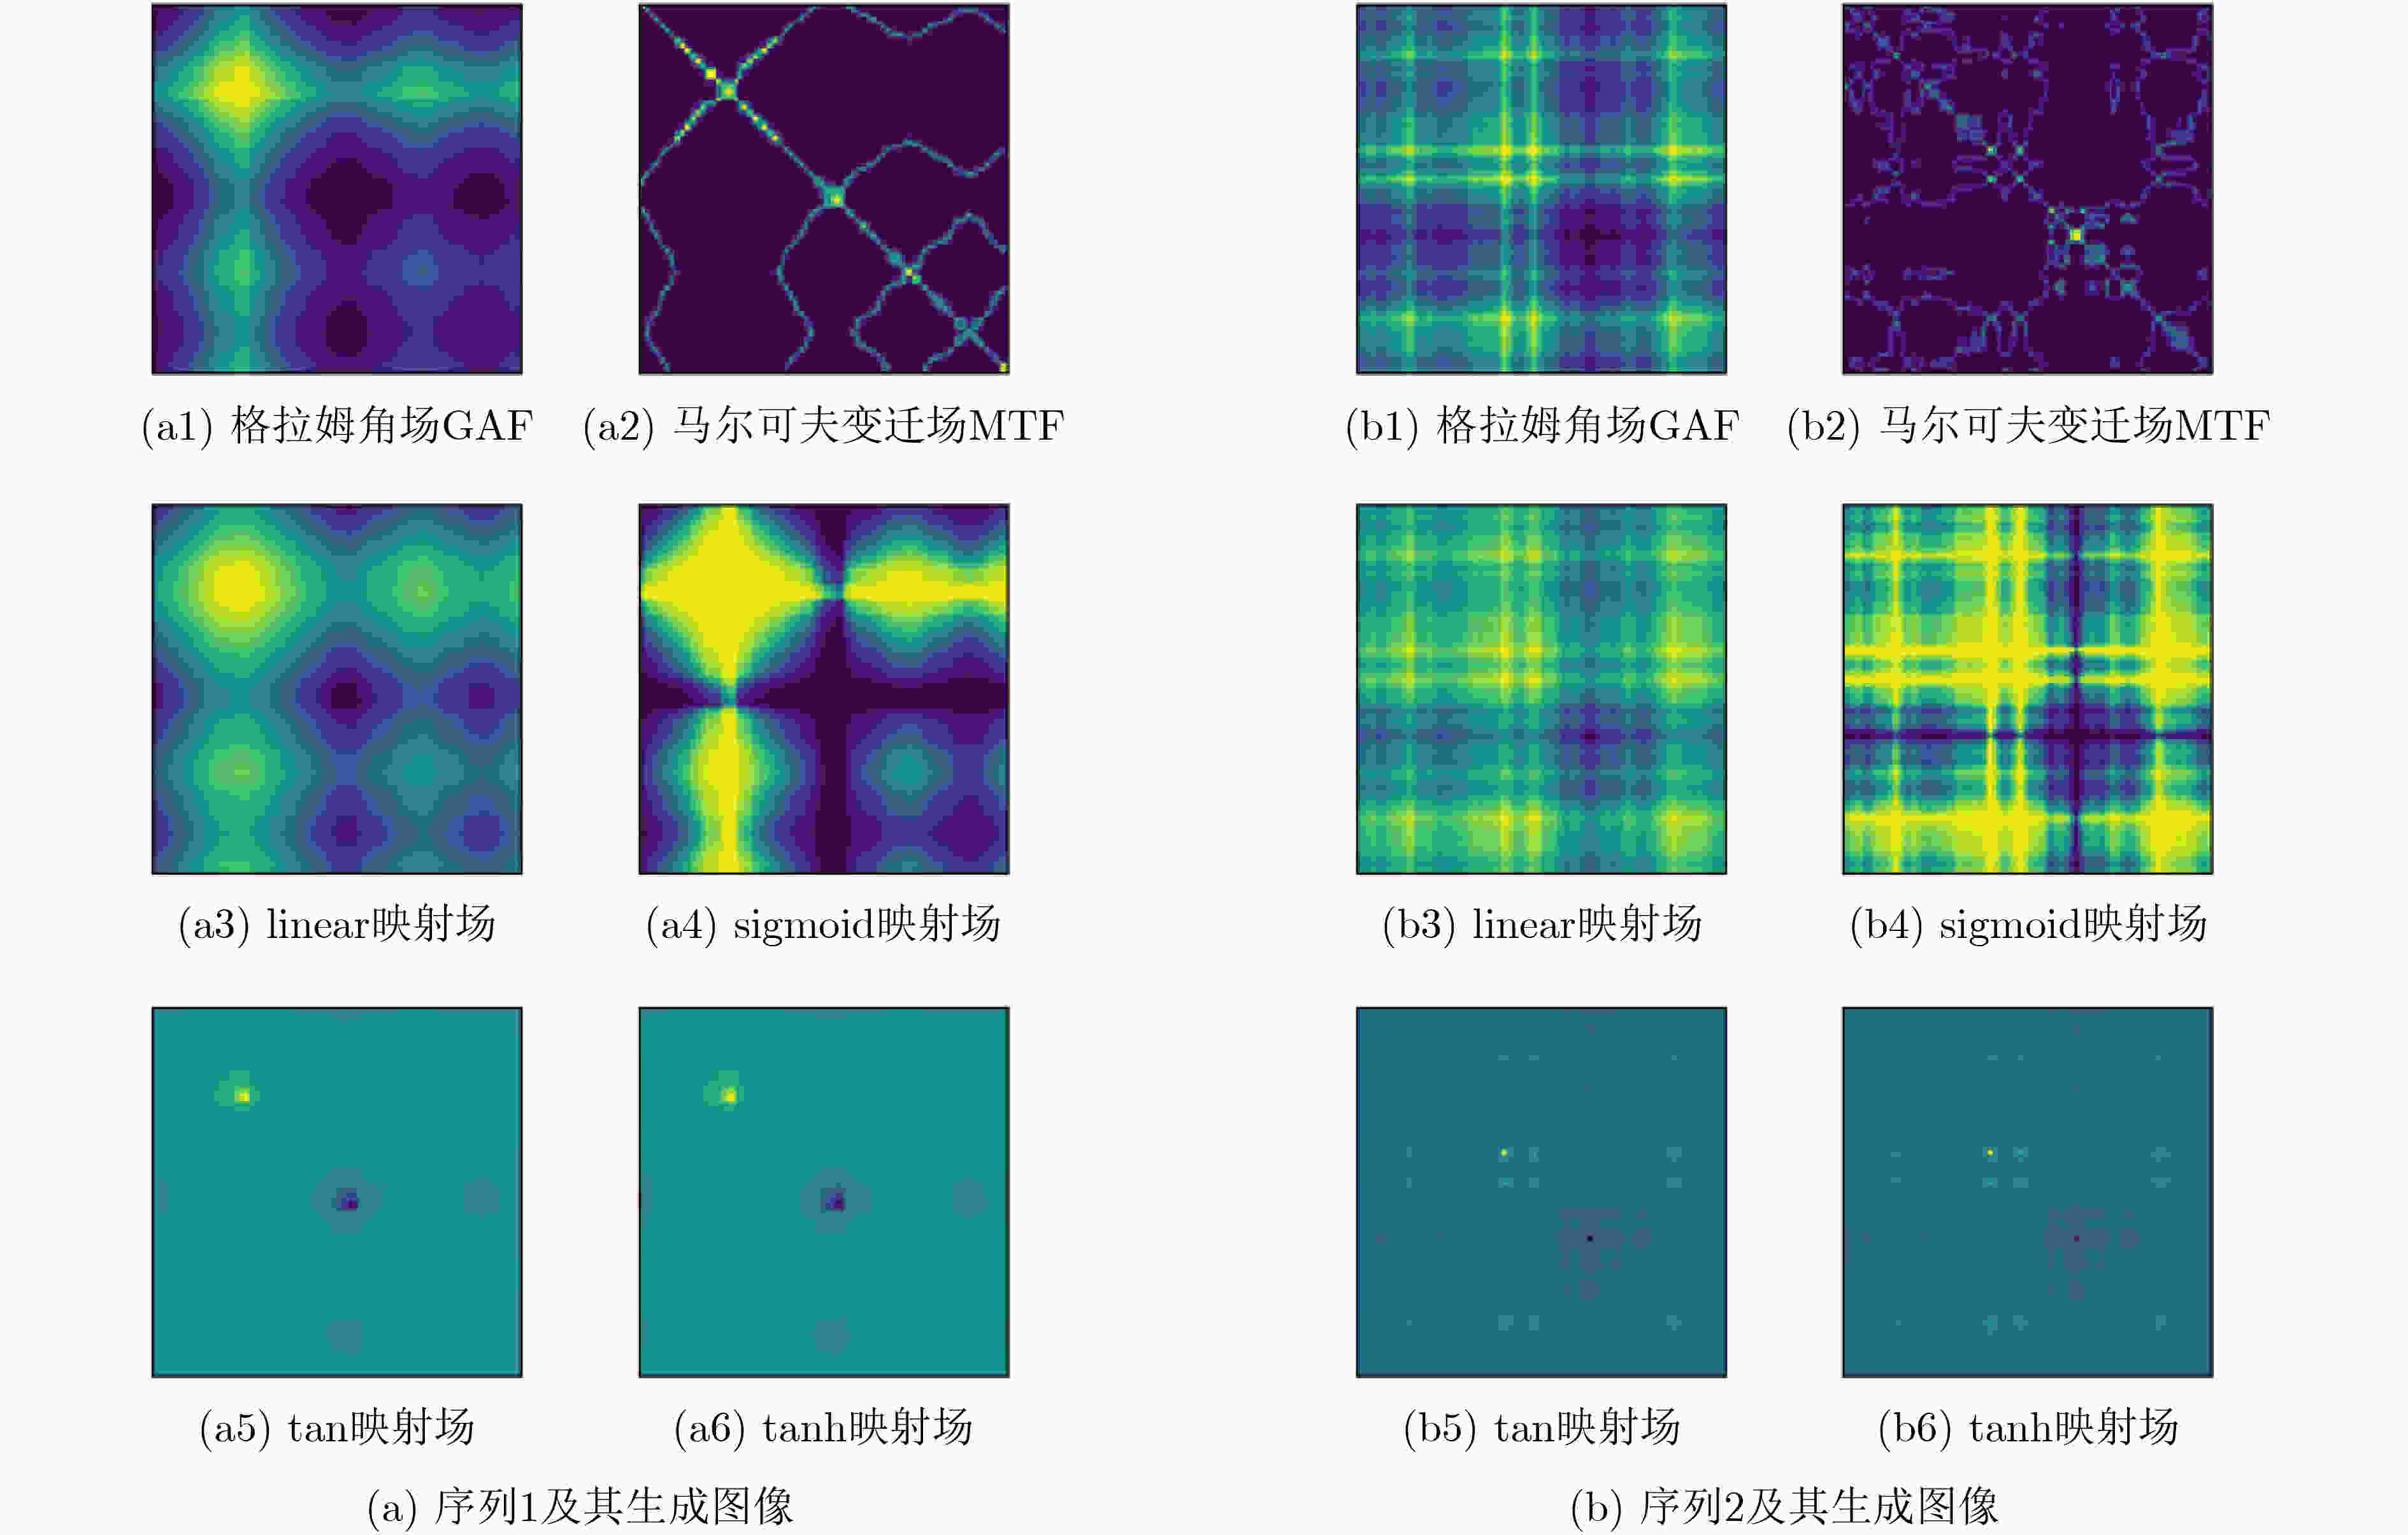
图像生成算法 图像尺寸 16 32 64 96 128 GAF 76.89 78.58 80.57 80.84 80.57 MTF 55.42 54.54 59.15 58.84 58.12 GAF+MTF 77.72 77.83 80.53 79.75 79.04 linear映射场 77.71 79.82 81.20 81.53 81.01 sigmoid映射场 77.29 79.03 80.71 80.88 80.20 tan映射场 70.94 68.09 68.41 68.34 68.63 tanh映射场 70.81 68.41 68.65 69.67 67.35 表 5 线性映射场与3种循环神经网络模型的分类性能对比
模型算法 分类准确度(%) Linear映射场 81.5 RNN 65.9 LSTM 64.4 GRU 65.5 表 6 自适应VMD模块的影响
三分类准确度(%) 使用自适
应VMD不使用自
适应VMD性能
提升图像生成算法 GAF 80.57 76.89 3.68 MTF 59.15 54.54 4.61 GAF-MTF 80.53 77.72 2.81 Linear映射场 81.20 77.74 3.46 sigmoid映射场 80.71 77.28 3.43 tan映射场 68.41 68.09 0.32 tanh映射场 68.65 67.35 1.30 传统机器学习算法 对数几率回归 49.71 54.53 –4.82 随机森林 67.85 72.37 –4.52 支持向量机 74.97 70.55 4.42 Adaboost 62.42 55.19 7.23 朴素贝叶斯 51.64 46.80 4.84 决策树 53.32 52.76 0.56 多层感知机 73.37 70.37 3.00 线性判别分析 58.71 69.95 –11.24 二次判别分析 65.95 72.82 –6.87 -
[1] 朱朝喆. 近红外光谱脑功能成像[M]. 北京: 科学出版社, 2020: 4–5.ZHU Chaozhe. Functional Near-infrared Spectropy[M]. Beijing: Science Press, 2020: 4–5. [2] JIANG Xingxing, SHEN Changqing, SHI Juanjuan, et al. Initial center frequency-guided VMD for fault diagnosis of rotating machines[J]. Journal of Sound and Vibration, 2018, 435: 36–55. doi: 10.1016/j.jsv.2018.07.039 [3] LIU Changfu, ZHU Lida, and NI Chenbing. Chatter detection in milling process based on VMD and energy entropy[J]. Mechanical Systems and Signal Processing, 2018, 105: 169–182. doi: 10.1016/j.ymssp.2017.11.046 [4] ZHANG Yagang, ZHAO Yuan, KONG Chunhui, et al. A new prediction method based on VMD-PRBF-ARMA-E model considering wind speed characteristic[J]. Energy Conversion and Management, 2020, 203: 112254. doi: 10.1016/j.enconman.2019.112254 [5] LU Chunming, ZHANG Yujin, BISWAL B B, et al. Use of fNIRS to assess resting state functional connectivity[J]. Journal of Neuroscience Methods, 2010, 186(2): 242–249. doi: 10.1016/j.jneumeth.2009.11.010 [6] ZHANG Han, ZHANG Yujin, LU Chunming, et al. Functional connectivity as revealed by independent component analysis of resting-state fNIRS measurements[J]. Neuroimage, 2010, 51(3): 1150–1161. doi: 10.1016/j.neuroimage.2010.02.080 [7] BRIER M R, THOMAS J B, FAGAN A M, et al. Functional connectivity and graph theory in preclinical Alzheimer's disease[J]. Neurobiology of Aging, 2014, 35(4): 757–768. doi: 10.1016/j.neurobiolaging.2013.10.081 [8] NIU Haijing, LU Chunming, ZHU Chaozhe, et al. Resting-state functional connectivity assessed with two diffuse optical tomographic systems[J]. Journal of Biomedical Optics, 2011, 16(4): 046006. doi: 10.1117/1.3561687 [9] KRIZHEVSKY A, SUTSKEVER I, and HINTON G E. ImageNet classification with deep convolutional neural networks[C]. The 25th International Conference on Neural Information Processing Systems, Lake Tahoe, USA, 2012: 1097–1105. [10] SIMONYAN K and ZISSERMAN A. Very deep convolutional networks for large-scale image recognition[C]. The 3rd International Conference on Learning Representations, San Diego, USA, 2015. [11] SZEGEDY C, LIU Wei, JIA Yangqing, et al. Going deeper with convolutions[C]. The IEEE Conference on Computer Vision and Pattern Recognition, Boston, USA, 2015: 1–9. [12] WANG Zhiguang and OATES T. Encoding time series as images for visual inspection and classification using tiled convolutional neural networks[C]. Workshops at the Twenty-Ninth AAAI Conference on Artificial Intelligence, Austin, USA, 2015: 40–46. [13] HUANG N E, SHEN Zheng, LONG S R, et al. The empirical mode decomposition and the Hilbert spectrum for nonlinear and non-stationary time series analysis[J]. Proceedings of the Royal Society A:Mathematical, Physical and Engineering Sciences, 1998, 454(1971): 903–995. doi: 10.1098/rspa.1998.0193 [14] WU Zhaohua and HUANG NORDEN E. Ensemble empirical mode decomposition: A noise-assisted data analysis method[J]. Advances in Adaptive Data Analysis, 2009, 1(1): 1–41. doi: 10.1142/S1793536909000047 [15] YEH J R, SHIEH J S, and HUANG N E. Complementary ensemble empirical mode decomposition: A novel noise enhanced data analysis method[J]. Advances in Adaptive Data Analysis, 2010, 2(2): 135–156. doi: 10.1142/S1793536910000422 [16] TORRES M E, COLOMINAS M A, SCHLOTTHAUER G, et al. A complete ensemble empirical mode decomposition with adaptive noise[C]. 2011 IEEE International Conference on Acoustics, Speech and Signal Processing (ICASSP), Prague, Czech Republic, 2011: 4144–4147. [17] DRAGOMIRETSKIY K and ZOSSO D. Variational mode decomposition[J]. IEEE Transactions on Signal Processing, 2014, 62(3): 531–544. doi: 10.1109/TSP.2013.2288675 [18] CHEN Junhao and TSAI Y C. Encoding candlesticks as images for pattern classification using convolutional neural networks[J]. Financial Innovation, 2020, 6(1): 26. doi: 10.1186/s40854-020-00187-0 [19] MITICHE I, MORISON G, NESBITT A, et al. Imaging time series for the classification of EMI discharge sources[J]. Sensors, 2018, 18(9): 3098. doi: 10.3390/s18093098 [20] BARRA S, CARTA S M, CORRIGA A, et al. Deep learning and time series-to-image encoding for financial forecasting[J]. IEEE/CAA Journal of Automatica Sinica, 2020, 7(3): 683–692. doi: 10.1109/JAS.2020.1003132 [21] HE Kaiming, ZHANG Xiangyu, REN Shaoqing, et al. Deep residual learning for image recognition[C]. The IEEE Conference on Computer Vision and Pattern Recognition. Las Vegas, USA, 2016: 770–778. [22] BAK S, PARK J, SHIN J, et al. Open-access fNIRS dataset for classification of unilateral finger- and foot-tapping[J]. Electronics, 2019, 8(12): 1486. doi: 10.3390/electronics8121486 [23] HOU Xin, ZHANG Zong, ZHAO Chen, et al. NIRS-KIT: A MATLAB toolbox for both resting-state and task fNIRS data analysis[J]. Neurophotonics, 2021, 8(1): 010802. doi: 10.1117/1.NPh.8.1.010802 [24] COMBRISSON E and JERBI K. Exceeding chance level by chance: The caveat of theoretical chance levels in brain signal classification and statistical assessment of decoding accuracy[J]. Journal of Neuroscience Methods, 2015, 250: 126–136. doi: 10.1016/j.jneumeth.2015.01.010 [25] GROSSMANN A and MORLET J. Decomposition of Hardy functions into square integrable wavelets of constant shape[J]. SIAM Journal on Mathematical Analysis, 1984, 15(4): 723–736. doi: 10.1137/0515056 [26] SIDDIQUE T and MAHMUD M S. Classification of fNIRS data under uncertainty: A Bayesian neural network approach[C]. 2020 IEEE International Conference on E-health Networking, Application & Services (HEALTHCOM), Shenzhen, China, 2021: 1–4. [27] KUANG Dongyang and MICHOSKI C. Dual stream neural networks for brain signal classification[J]. Journal of Neural Engineering, 2021, 18(1): 016006. doi: 10.1088/1741-2552/abc903 [28] ZAREMBA W, SUTSKEVER I, and VINYALS O. Recurrent neural network regularization[J]. arXiv: 1409.2329, 2014. [29] SHI Xingjian, CHEN Zhourong, WANG Hao, et al. Convolutional LSTM network: A machine learning approach for precipitation nowcasting[C]. The 28th International Conference on Neural Information Processing Systems, Montréal, Canada, 2015: 802–810. [30] CHO K, VAN MERRIËNBOER B, GULCEHRE C, et al. Learning phrase representations using RNN encoder-decoder for statistical machine translation[C]. The 2014 Conference on Empirical Methods in Natural Language Processing, Doha, Qatar, 2014: 1724–1734. -


 下载:
下载:




 下载:
下载:
