Novel Method for Outlier Nodes Detection and Localization in Wireless Sensor Networks
-
摘要: 无线传感器网络中异常节点检测是确保网络数据准确性和可靠性的关键步骤。基于图信号处理理论,该文提出了一种新的无线传感器网络异常节点检测定位算法。新算法首先对网络建立图信号模型,然后基于节点域-图频域联合分析的方法,实现异常节点的检测和定位。具体而言,第1步是利用高通图滤波器提取网络信号的高频分量。第2步首先将网络划分为多个子图,然后筛选出子图输出信号的特定频率分量。第3步对筛选出的子图信号进行阈值判断从而定位疑似异常的子图中心节点。最后通过比较各子图的节点集合和疑似异常节点集合,检测并定位出网络中的异常节点。实验仿真表明,与已有的无线传感器网络中异常检测方法相比,新算法不仅有着较高的异常检测概率,而且异常节点的定位率也较高。
-
关键词:
- 无线传感器网络 /
- 异常检测 /
- 图信号处理 /
- 子图 /
- 节点域-图频域联合分析
Abstract: The outlier nodes detection and localization in Wireless Sensor Networks (WSNs) is a crucial step in ensuring the accuracy and reliability of network data acquisition. Based on the theory of graph signal processing, a novel algorithm is presented for outlier detection and localization in WSNs. The new algorithm first builds the graph signal model of the network, then detect the location of the outlier based on the method of vertex-domain and graph frequency-domain joint analysis. Specifically speaking, the first step of algorithm is extracting the high-frequency component of the signal using a high-pass graph filter. In the second step, the network is decomposed into a set of sub-graphs, and then the specific frequency components of the output signal in sub-graphs are filtered out. The third step is to locate the suspected outlier center-nodes of sub-graphs based on the threshold of the filtered sub-graphs signal. Finally, the outlier nodes in the network are detected and located by comparing the set of nodes of each sub-graph with the set of suspected outlier nodes. Experimental results show that compared with the existing outlier detection methods in networks, the proposed method not only has higher probability of outlier detection, but also has a higher positioning rate of outlier nodes. -
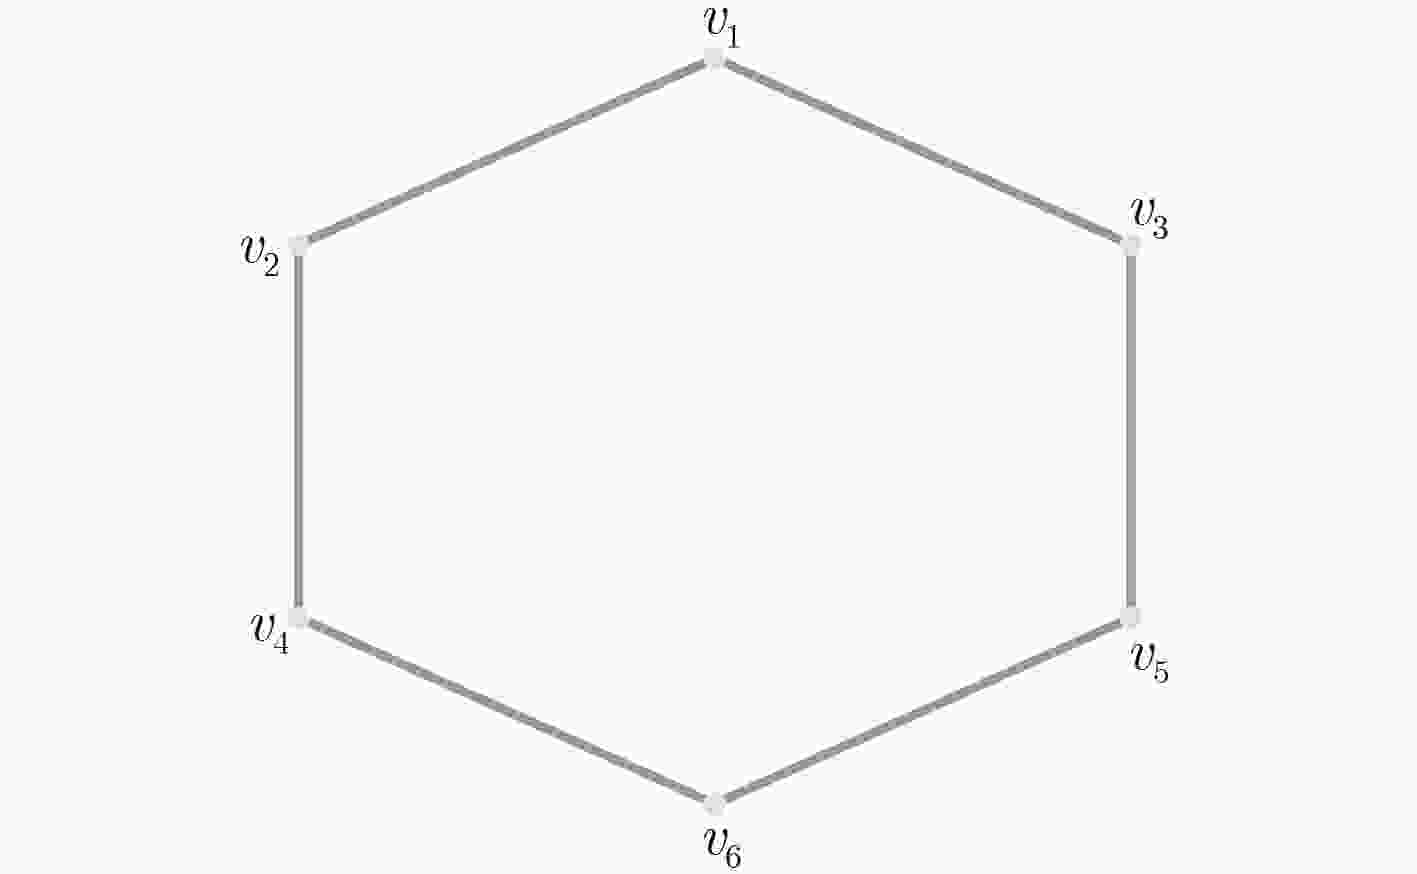
表 1 环状图模型的匹配筛选表
${V_i}$( ${V_i}$的中心节点为 ${v_i}$) 匹配筛选 筛选结果 ${V_1} = \{ {v_1},{v_2},{v_3}\} $ ${V_1} \not\subset {V_{\rm A}}$ ${v_1}$不是异常节点 ${V_2} = \{ {v_1},{v_2},{v_4}\} $ ${V_2} \subset {V_{\rm A}}$ ${v_2}$是异常节点 ${V_3} = \{ {v_1},{v_3},{v_5}\} $ ${V_3} \not\subset {V_{\rm A}}$ ${v_3}$不是异常节点 ${V_4} = \{ {v_2},{v_4},{v_6}\} $ ${V_4} \not\subset {V_{\rm A}}$ ${v_4}$不是异常节点 ${V_5} = \{ {v_3},{v_5},{v_6}\} $ ${V_5} \not\subset {V_{\rm A}$ ${v_5}$不是异常节点 ${V_6} = \{ {v_4},{v_5},{v_6}\} $ ${V_6} \not\subset {V_{\rm A}}$ ${v_6}$不是异常节点 表 2 美国主要城市温度网络中单个节点信号值异常增大情况的检测指标(%)
$\tau $ DR OPR OPR (OS≤5) 2 98.5 94.2 64.2 3 95.4 89.7 69.3 4 90.6 84.5 69.0 表 3 美国主要城市温度网络中单个节点信号值异常置零情况的检测指标(%)
$\tau $ DR OPR OPR (OS≤5) 2 99.7 98.3 67.0 3 99.2 97.7 76.4 4 98.4 96.9 80.4 表 4 美国主要城市温度网络中5个节点信号值异常增大情况的检测指标(%)
$\tau $ DR OPR OPR (OS≤10) 2 100.0 72.5 26.1 3 100.0 58.3 24.6 4 99.9 46.5 20.6 表 5 美国主要城市温度网络中5个节点信号值异常置零情况的检测指标(%)
$\tau $ DR OPR OPR (OS≤10) 2 100.0 92.5 32.8 3 99.9 89.9 39.9 4 99.9 86.9 42.6 表 6 海平面部分温度站点网络单节点异常增大情况的检测指标(%)
$\tau $ DR OPR OPR (OS≤5) 2 99.9 99.8 78.5 3 99.6 99.4 85.5 4 99.0 98.8 88.6 表 7 海平面部分温度站点网络单节点异常置零情况的检测指标(%)
$\tau $ DR OPR OPR (OS≤5) 2 99.8 99.7 81.9 3 99.7 99.5 87.8 4 99.5 99.3 90.6 表 8 海平面部分温度站点网络5个节点异常增大情况的检测指标(%)
$\tau $ DR OPR OPR (OS≤10) 2 100.0 98.7 36.7 3 100.0 96.7 41.4 4 99.9 92.9 42.6 表 9 海平面部分温度站点网络5个节点异常置零情况的检测指标(%)
$\tau $ DR OPR OPR (OS≤10) 2 100.0 99.6 36.7 3 100.0 99.5 41.8 4 100.0 99.3 44.8 -
SHUKLA D S, PANDEY A C, and KULHARI A. Outlier detection: A survey on techniques of WSNs involving event and error based outliers[C]. 2014 Innovative Applications of Computational Intelligence on Power, Energy and Controls with their impact on Humanity (CIPECH), Ghaziabad, India, 2014: 113–116. XU Yang and LIU Fugui. Application of wireless sensor network in water quality monitoring[C]. 2017 IEEE International Conference on Computational Science and Engineering (CSE) and International Conference on Embedded and Ubiquitous Computing (EUC), Guangzhou, China, 2017: 368–371. DING Hui. Application of wireless sensor network in target detection and localization[J]. TELKOMNIKA Indonesian Journal of Electrical Engineerign, 2013, 11(10): 5734–5740 doi: 10.11591/telkomnika.v11i10.3400 ZHU Yingli, SONG Jingjiang, and DONG Fuzhou. Applications of wireless sensor network in the agriculture environment mon-itoring[J]. Procedia Engineering, 2011, 16(1): 608–614 doi: 10.1016/j.proeng.2011.08.1131 AKYILDIZ I F, SU Weilian, SANKAROSUBRAMANIAM Y, et al. A survey on sensor networks[J]. IEEE Communications Magazine, 2002, 40(8): 102–114 doi: 10.1109/MCOM.2002.1024422 李鹏, 王建新, 曹建农. 无线传感器网络中基于压缩感知和GM(1, 1)的异常检测方案[J]. 电子与信息学报, 2015, 37(7): 1586–1590 doi: 10.11999/JEIT141219LI Peng, WANG Jianxin, and CAO Jiannong. Abnormal event detection scheme based on compressive sensing and GM(1,1) in wireless sensor networks[J]. Journal of Electronics&Information Technology, 2015, 37(7): 1586–1590 doi: 10.11999/JEIT141219 SINGH K and UPADHYAYA S. Outlier detection: Applications and techniques[J]. International Journal of Computer Science Issues, 2012, 9(1): 307–323. ZHANG Yang, HAMM N A S, MERATNIA N, et al. Statistics-based outlier detection for wireless sensor networks[J]. International Journal of Geographical Information Science, 2012, 26(8): 1373–1392 doi: 10.1080/13658816.2012.654493 ANDRADE A T C, MONTEZ C, MORAES R, et al. Outlier detection using k-means clustering and lightweight methods for Wireless Sensor Networks[C]. The 42nd Annual Conference of the IEEE Industrial Electrics Society (IECON 2016), Florence, Italy, 2016: 4683–4688. AYADI A, GHORBEL O, BENSALEH M S, et al. Performance of outlier detection techniques based classification in wireless sensor networks[C]. The 13th IEEE Wireless Communications and Mobile Computing Conference (IWCMC 2017), Valencia, Spain, 2017: 687–692. ABID A, KACHOURI A, and MAHFOUDHI A. Anomaly detection through outlier and neighborhood data in Wireless Sensor Networks[C]. The 2nd International Conference on Advanced Technologies for Signal and Image Processing, Monastir, Tunisia, 2016: 26–30. SANDRYHAILA A and MOURA J M F. Discrete signal processing on graphs: Frequency analysis[J]. IEEE Transactions on Signal Processing, 2014, 62(12): 3042–3054 doi: 10.1109/TSP.2014.2321121 SHUMAN D I, NARANG S K, FROSSARD P, et al. The emerging field of signal processing on graphs: Extending high-dimensional data analysis to networks and other irregular domains[J]. IEEE Signal Processing Magazine, 2012, 30(3): 83–98 doi: 10.1109/MSP.2012.2235192 SANDRYHAILA A and MOURA J M F . Discrete signal processing on graphs: Graph filters[C]. 2013 IEEE International Conference on Acoustics, Speech and Signal Processing, Vancouver, Canada, 2013: 6163–6166. CHEN Siheng, VARMA R, SANDRYHAILA A, et al. Discrete signal processing on graphs: Sampling theory[J]. IEEE Transactions on Signal Processing, 2015, 63(24): 6510–6523 doi: 10.1109/TSP.2015.2469645 SHUMAND I, RICAUD B, and VANDERGHEYNST P. A windowed graph Fourier transform[C]. 2012 IEEE Statistical Signal Processing Workshop (SSP 2012), Ann Arbor, USA, 2012: 133–136. HAMMOND D K, VANDERGHEYNST P, and GRIBONVAL R. Wavelets on graphs via spectral graph theory[J]. Applied&Computational Harmonic Analysis, 2011, 30(2): 129–150 doi: 10.1016/j.acha.2010.04.005 林丽. 两组独立数据差异性统计检验方法及应用的研究[D]. [硕士论文], 上海交通大学, 2007.LIN Li. Equivalence test method and application study for two independent data groups[D]. [Master dissertation], Shanghai Jiao Tong University, 2007. QIU Kai, MAO Xianghui, SHEN Xinyue, et al. Time-varying graph signal reconstruction[J]. IEEE Journal of Selected Topics in Signal Processing, 2017, 11(6): 870–883 doi: 10.1109/ JSTSP.2017.2726969 -


 下载:
下载:


 下载:
下载:
